Test Framework
Testing is a major part of any software project, for many reasons:
- It allows us to verify that a given feature is working as expected when a new feature is added.
- When we add a new feature, having existing tests allow us to verify that that new feature doesn't break existing behavior.
- Tests also serve as a form of documentation when done well. If you think about it, when we make a new change and get all tests to pass, what we are really doing is documenting the current behavior of the system with all of our tests. In the future, if and when that behavior is modified, that test will fail, notifying us that this behavior has changed. We can then decide if this failure was intentional/expected (and change the test to match the new behavior), or if we have caught a bug (and we need to go back and change the implementation of the new feature).
Our test framework contains two broad parts:
- Command Line Interfaces (CLIs) which are tools that allow you to treat Runtime as a "black box" and provide it inputs by pretending to be Dawn, Shepherd, or Arduino devices connecting / disconnecting from Runtime.
- Automated Testing which allows us to do the three points mentioned above
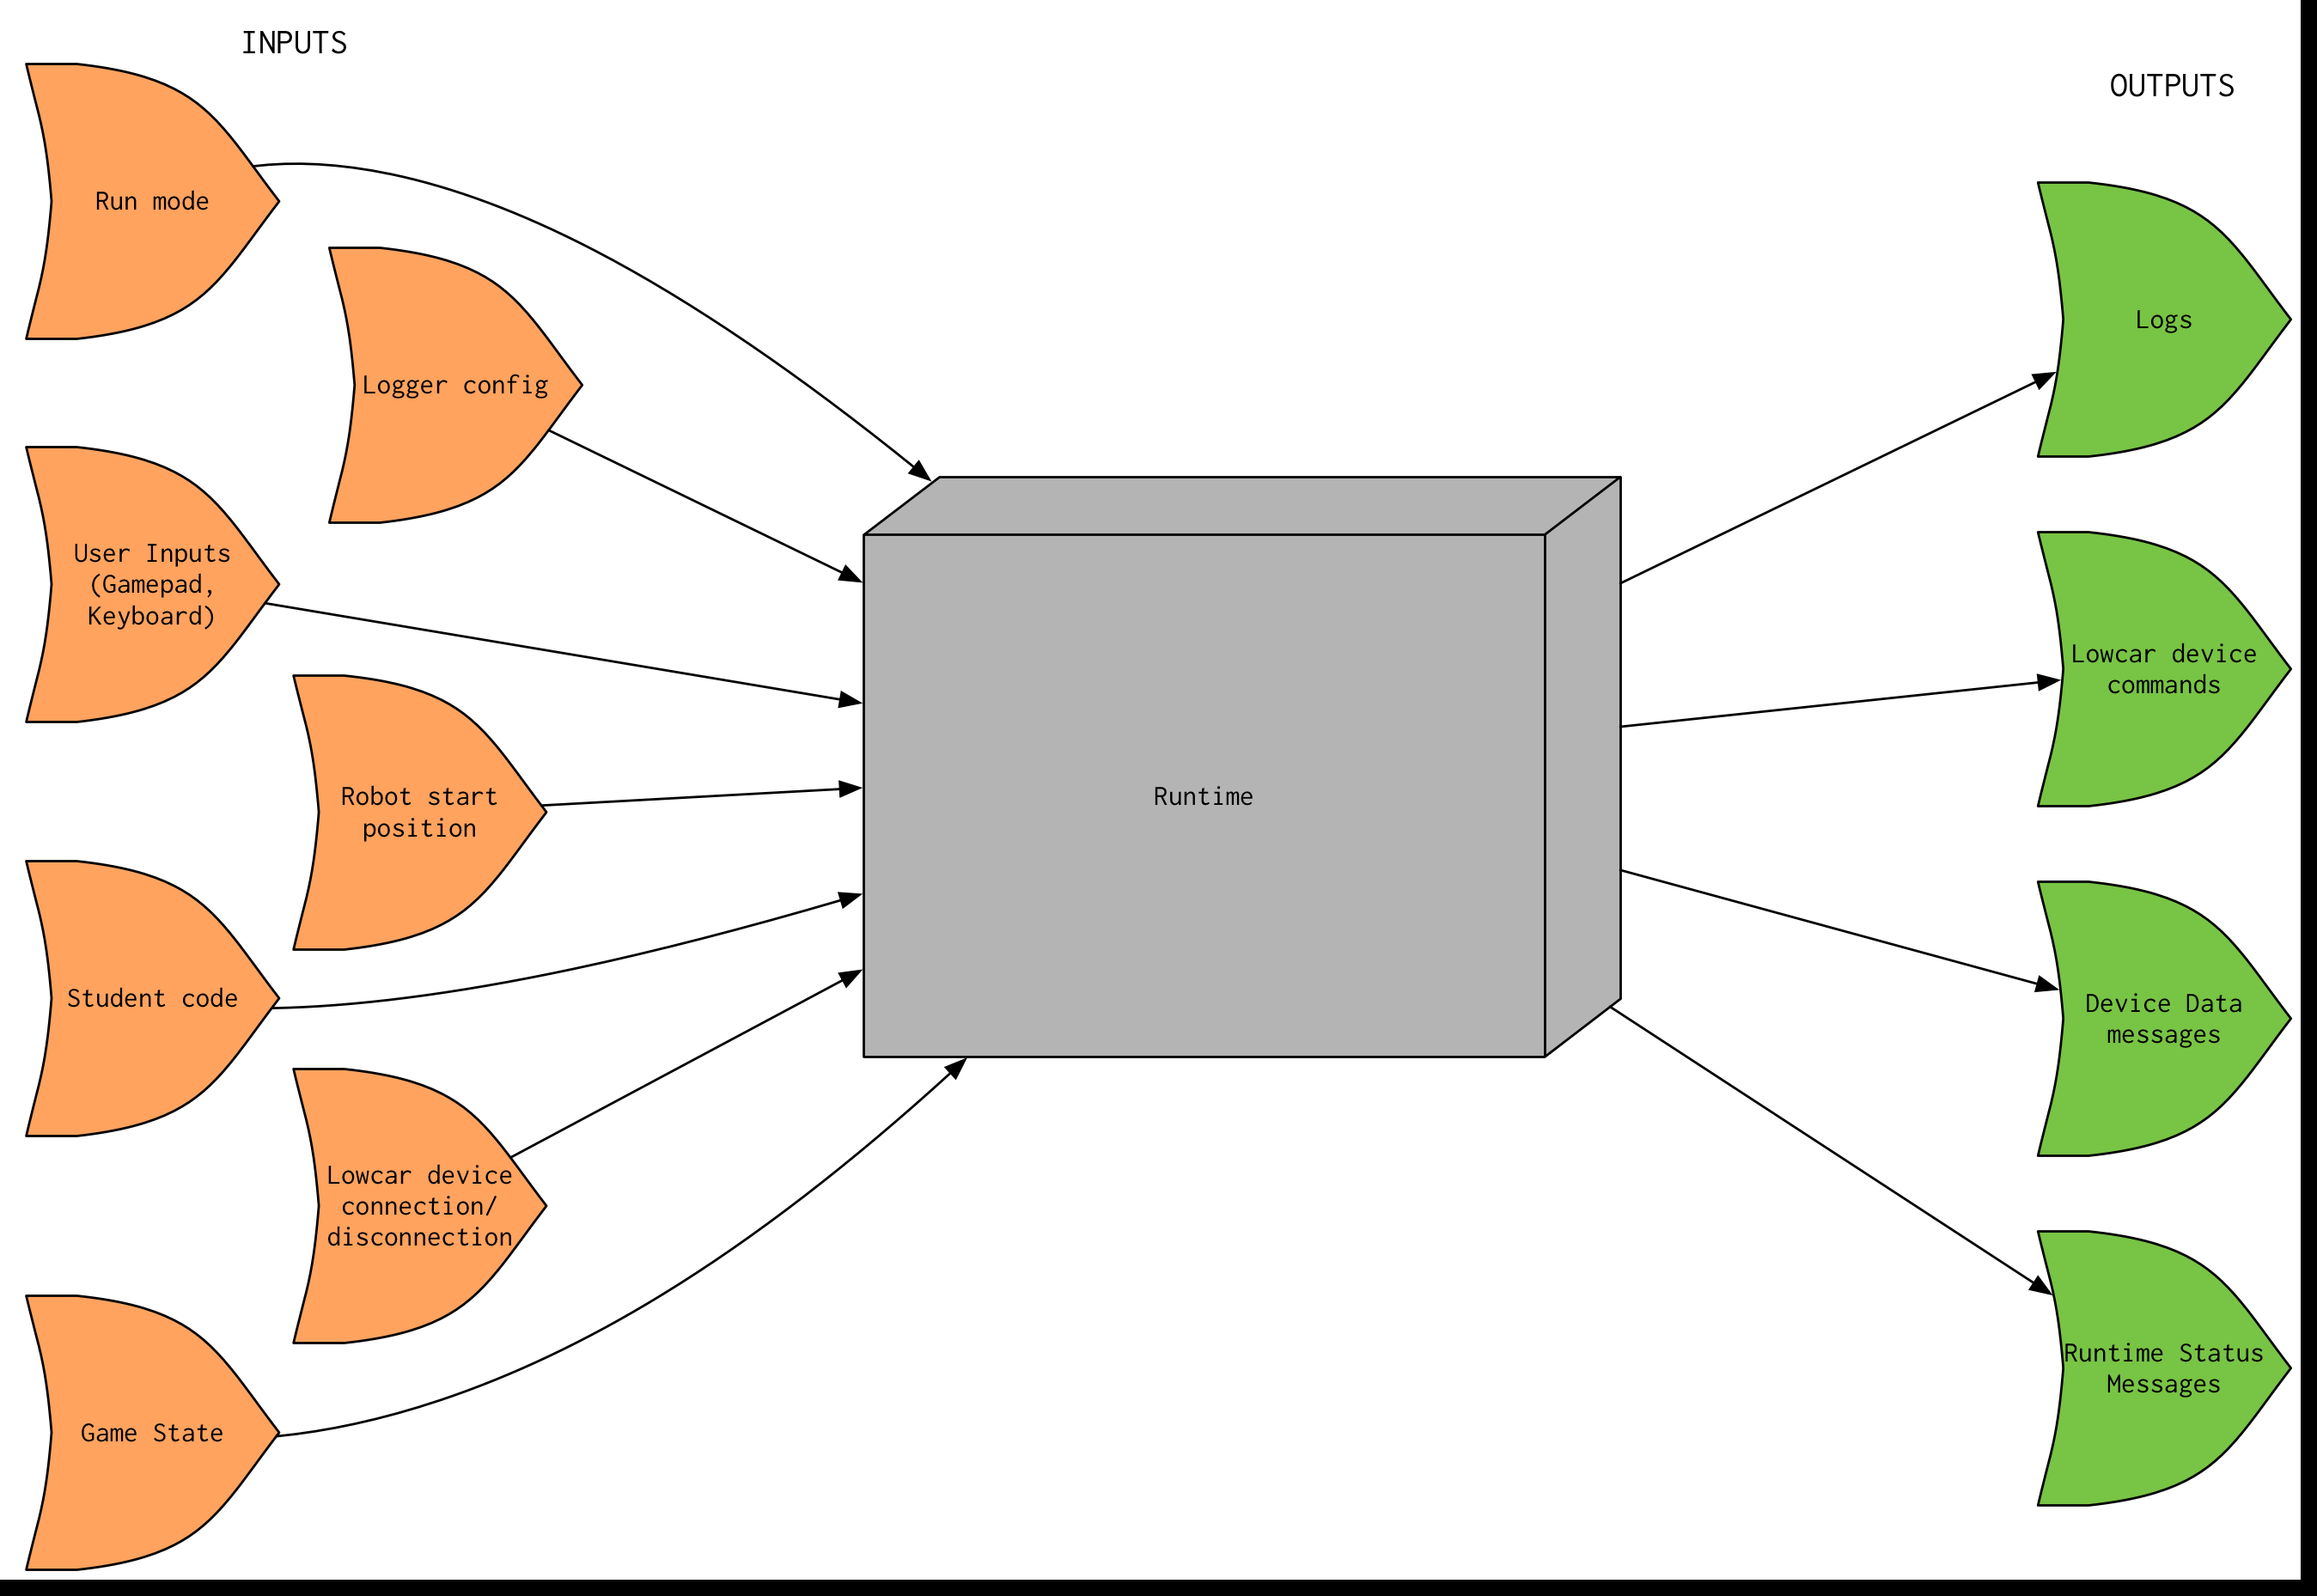
At an extremely high level, the way we test Runtime is by "black-boxing" it, i.e. we try to abstract Runtime itself away as just a "function" (a black box) that receives input and generates some output as a result of those inputs. The inputs and outputs that we receive can be visualized in the following diagram (runtime-docs/Runtime-Black-Box.png):
This means that in order to test Runtime, we need three things:
- Some way to "spawn" Runtime locally on a computer, without any external stimuli (ex. Shepherd connecting, Dawn connecting, devices connecting...)
- A set of functions that we can call from a test that can send commands to this "spawned" Runtime that mimics external stimuli interacting with Runtime
- Some way to examine the state of Runtime at any given time and capture the outputs generated by Runtime throughout the test so that we can actually verify that Runtime is behaving correctly for the given set of inputs.
The first point is accomplished by writing functions in the process clients that start and stop their respective processes. For example, the net_handler_client has two functions, net_handler_start and net_handler_stop, which spawn and kill net_handler running locally on the machine.
The second point is accomplished by writing additional functions in the process clients for the tests to call to either send Runtime input or retrieve/examine its output. For example, shm_client has the print_shm function, which prints out the state of shared memory at that time for use in verifying the state of the system.
The third point is accomplished by the aforementioned print_shm function to examine the state of Runtime (virtually all of Runtime's static internal state is contained within shared memory) and special functions in net_handler_client that "dump" received TCP and UDP data from Runtime to the screen. So, when using net_handler_client, the output you see on the screen is exactly what you would see in the Dawn console by the student.
Test Cases (tcs) are named like so: tc_<Github issue number>_<test number>. The Github issue number is the number of the Github issue that defined that behavior, not the issue that called for the tests. In other words, suppose there is an issue that calls for a certain new feature in Runtime to be added. It's common for there to be a separate issue that is made for writing tests to make sure the new behavior caused by that new feature is being implemented. The tc name should reference the issue in which the new feature is described, not the issue that calls for the tests. This is so that if and when that test fails in the future, the person whose changes are causing that test to fail can go back to that Github issue and read the exact definition of the feature for which the failing test was written to test. The "exception" to this rule is our first set of tests, which all reference Github issue 68. That issue contains a link to a master document describing the behavior of Runtime at the time of version 1.0, and so all of the tests in that first set were written to verify Runtime version 1.0 (and to verify that this test framework was functional).
To explain the usefulness of this convention, let's go through an example of a possible workflow:
- A new feature that implements some new behavior is completed. The issue number that defines this behavior is issue 100, and the person who implemented that behavior has written up a good description of the new behavior, including edge-case handling, in that issue.
- Tests are written to verify that the new feature is working, numbered
tc_100_1,tc_100_2,tc_100_3, andtc_100_4. Once those tests pass, they are merged intomasterand become part of the Runtime codebase. - Some time later (weeks, months, etc.), a new feature that has some effects on the behavior defined in issue 100 is implemented by a different person.
- Tests are written to verify that the new feature is working. However, when the test suite is run, we see that
tc_100_1,tc_100_2,tc_100_3, andtc_100_4all fail. It is easy for the person writing the tests to determine what previous behavior was being tested with those failing tests, and determine if the tests are failing expectedly (because the newly implemented behavior changed past behavior) or the failing tests are catching a bug in the new implementation! This is the whole point, because without the convention and the ease of finding the definition of past behavior, it is really hard to find what the test was actually supposed to be testing, what feature / behavior was being verified by that test, and whether that behavior needs to change with the new feature.
If new features override the behavior of old features, the test case should retain the same name, but a comment added to the old Github issue referencing the new Github issue saying that the behavior has changed and the test case was modified to reflect that change in behavior. Then, go ahead and modify the test so that it passes and now verifies the new behavior.
Tests are only useful if the output that they produce is consistent each time they run; if they weren't consistent, how could we verify that a certain behavior is actually being exhibited by Runtime? The problem with Runtime is that everything is asynchronous, meaning that there is not necessarily a predetermined order for certain events to happen relative to each other. For example, once a given gamepad state has arrived on Runtime and processed by net_handler, it is written to shared memory. The amount of time that passes between that write occurring and executor reading that new value into student code is short (ideally), but non-deterministic. If we were to run our tests at full speed, i.e. no time at all between sending each input, the tests would therefore be inconsistent. So, in our tests, we must make sure to separate our inputs to allow Runtime to finish doing everything that needs to be done to respond to a given input before we give it the next input.
The way this is currently done is each net_handler_client function currently has a 1-second sleep at the very end of the function, which basically pauses the test or CLI for a second and allows net_handler some time to generate its output before the next input is issued. This gives each test a "clock" that "ticks" once per second; it is up to the test-writer to ensure that two events do not happen on the same "clock tick".
Care must also be taken when writing sample student code for tests; if the student code calls the print function, the output will show up as a log in Dawn. If a test is written so that the student code prints while a mode is being changed, for example, the test will be inconsistent. Sometimes the student print will execute and will show up in Dawn before the mode is changed; sometimes the mode change will happen first and the print will not show up. When designing the test, you must take all of that into account and make sure you know exactly what you want the system to do.
The table below shows the timeline of events in the executor sanity test, tc_68_2, and what each input generates in the test log. This test loads in some code that prints something out every 2 seconds in autonomous mode, and errors immediately in teleop mode.
| Time Step (seconds) | Action | Expected Output |
|---|---|---|
| 1 | start_shm | N/A |
| 2 | start_net_handler | N/A |
| 3 | start_executor | N/A |
| 4 | send_start_pos RIGHT | N/A |
| 5 | send_run_mode AUTO | first print from student code |
| 6 | print_shm | current state of shm |
| 7 | sleep 2 | second print from student code |
| 8 | " | N/A |
| 9 | send_run_mode IDLE | N/A |
| 10 | print_shm | current state of shm |
| 11 | send_run_mode TELEOP | error from student code |
| 12 | print_shm | current state of shm |
| 13 | send_run_mode IDLE | N/A |
| 14 | print_shm | current state of shm |
| 15+ | (test continues) | ... |
This section does a deep dive into some of the more obtuse and quirky parts of the test framework that we felt needed some explanation.
Recall that the goal of the test framework is to be able to "black-box" Runtime: spawn Runtime by starting up its processes/components, give it some inputs, examine its outputs, verify that they're correct, and then terminate Runtime—all from within a test program (not manually done). The process clients and process CLIs help us do exactly that.
For each process in Runtime (and shared memory), there is a corresponding client for that process. The client is not another process! Rather, it is an interface for a program to use to interact with the corresponding Runtime process. For example, the net_handler_client.h file defines the functions that a program can use to interact with net_handler. These functions include: sending various types of messages to Runtime via TCP or UDP connections, starting and stopping net_handler, and viewing the device data coming back from Runtime on UDP. Notice that this includes starting and stopping net_handler. To understand how net_handler_client (and the other clients as well) start and stop their respective Runtime processes, first read the wiki page on processes for an overview of UNIX processes and management.
Starting the corresponding process is done by forking the program, and then calling execlp on the actual executable for the corresponding Runtime process to spawn the Runtime process. Stopping the Runtime process is done by sending the spawned Runtime process SIGINT with the kill function, and then waiting for the process to terminate using the waitpid function.
For each process in Runtime (and shared memory), there is also a corresponding CLI for that process. The CLI is a process that uses the corresponding client to allow a user to interact with the corresponding Runtime process via the command line. This is really useful for getting to know Runtime, or just poking the system around manually. The CLIs also provide a way to test the test framework and clients manually, without trying to write tests to test if the clients are working.
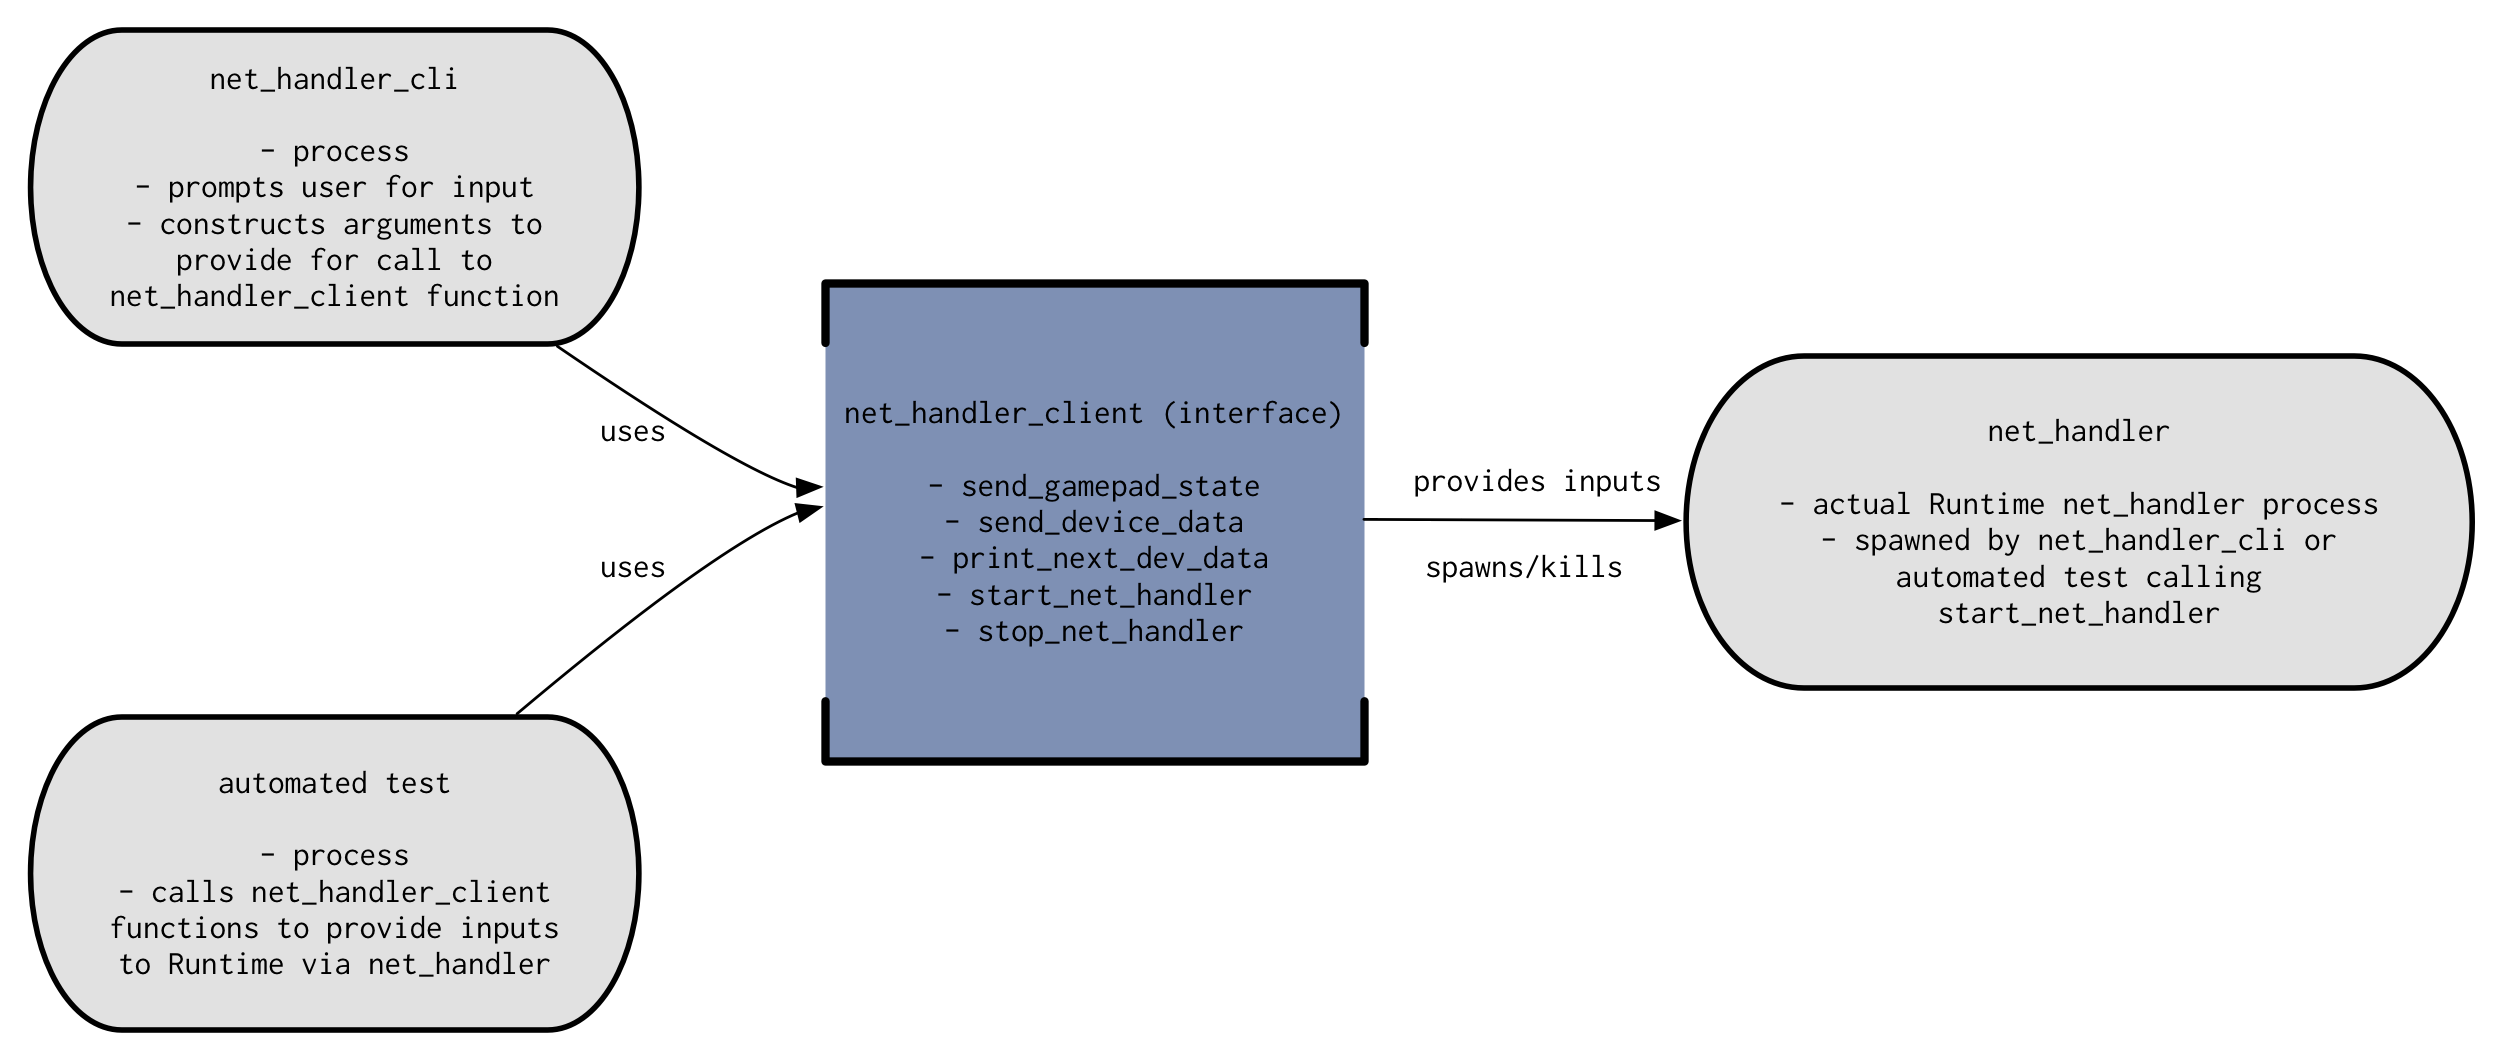
All of the interfaces provided by all of the clients COMBINED, plus the functions provided in test.h, make up the functions that are available for use in automated tests in tests/integration. This combined interface should give the test the ability to start and stop any Runtime process, to retrieve the output and examine the state of Runtime, and to provide inputs to the system. The diagram below shows the relationship between an automated test, the net_handler_cli, net_handler_client, and net_handler itself (this diagram applies in general (sort of—more caveats later) to all Runtime client/CLI/process trios). (runtim-docs/CLI-Client-Test-Relationship.png):
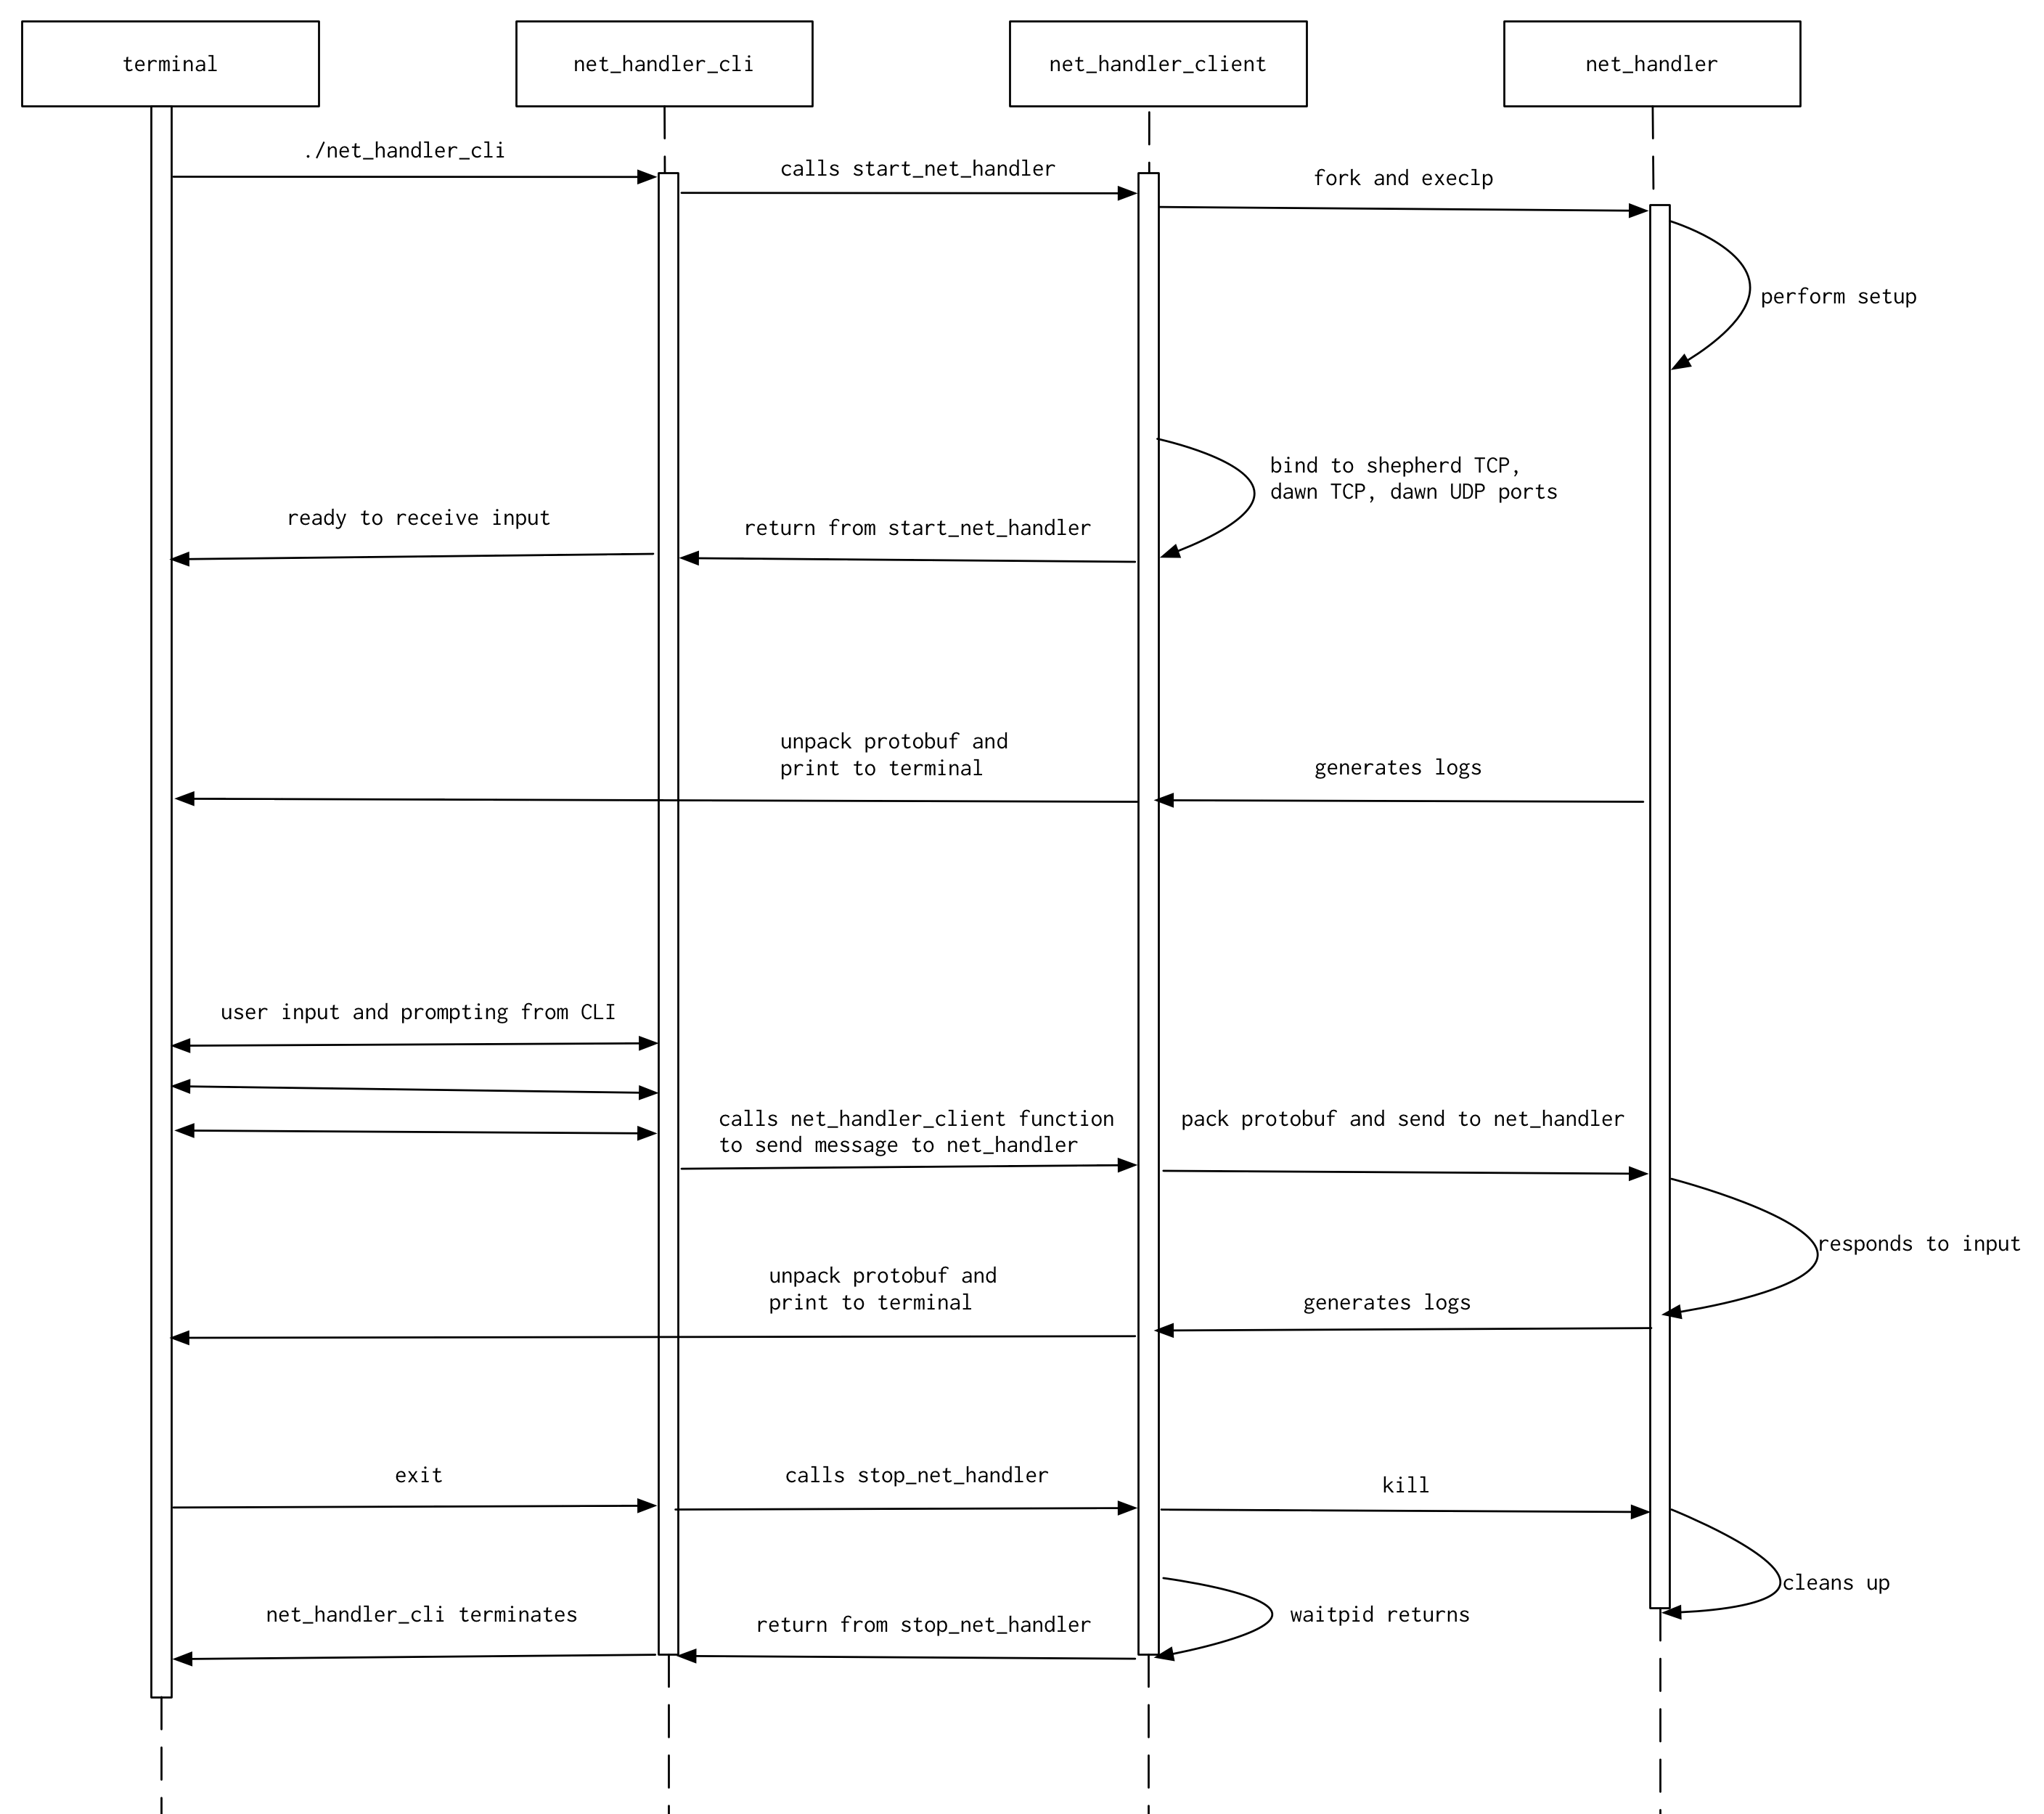
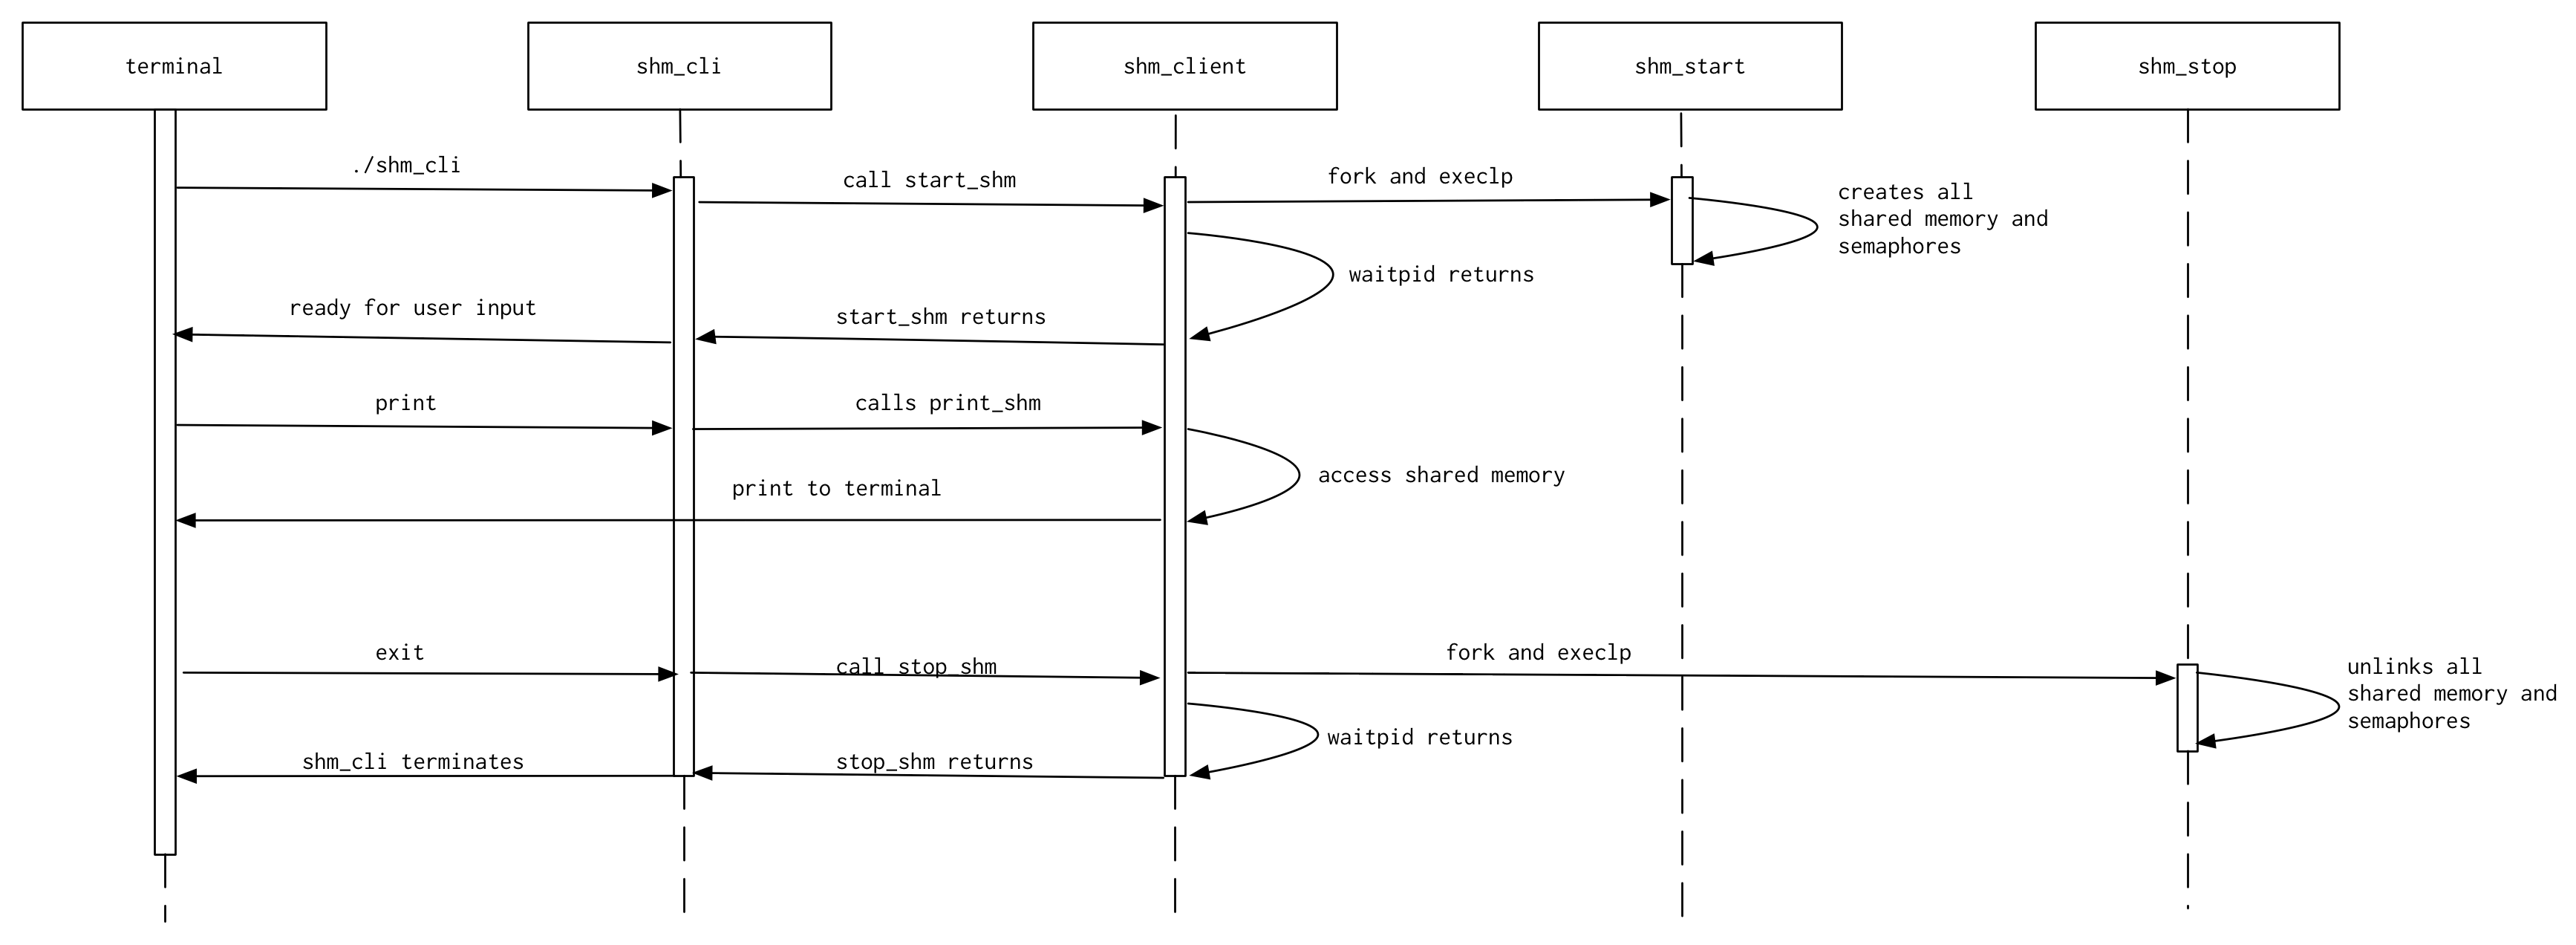
Below is a diagram showing the typical usage of a client (here, net_handler_client is used as an example) and the lifetime of the spawned net_handler process. Time passes from top to bottom, and the white boxes on the dotted lines indicate the time that the given entity is in existence / is being used. (runtime-docs/Client-Lifetime.png):
The goal of this section is to describe how we get executor to be able to find sample student code used for testing in the tests/student_code folder in our library.
Every Python file (<something>.py) is a Python module. You're probably familiar with the import keyword in Python; what it's doing is that it's specifying that the current module should import some other module on your system. Let's illustrate with an example:
Suppose I have a directory called foo and I have a file bar.py and another file baz.py in that directory. Since they're in the same directory, if in baz.py I write import bar, baz will have imported bar.py as a module for use in baz.py. Now, in bar.py, I can call functions in baz.py!
In executor, we normally execute studentcode.py, which is located in the executor directory. In order for executor to run student code, it must import it as a module. (More on this in the executor wiki.) So, we essentially do an import studentcode and voila, we can access all of the student code functions in executor. The problem is that when you try to import a module that is outside the directory that you're in, Python doesn't know where to begin to look for those modules! (This is actually smart, you don't want Python to go searching your entire file system for a module, which would take forever.) This is the problem that we run into when trying to import modules in tests/student_code from executor.
The way to tell Python where to look for modules is by adding additional directories to search in the PYTHONPATH environment variable. In other words, if we're in the executor folder and we add ../tests/student_code to PYTHONPATH, all of a sudden executor will know to search in that folder for modules, and will find the sample student code for the tests.
There are two places where we would like the ability to add that folder to the PYTHONPATH environment variable:
- In automated tests, to supply
executorwith student code to run tests on - In the CLI, to try and manually recreate tests (or for experimenting with Runtime without touching
studentcode.py)
In the first case, the modification of the PYTHONPATH environment variable is done by the test.sh shell script that we use to run automated tests.
In the second case, the modification of the PYTHONPATH environment variable is done by the start_executor function in executor_client.c, with all of the logic that uses getenv and setenv before calling execlp on executor to start up the actual Runtime executor process.
The shm_client is unlike the other clients in that it does not spawn a process in its start function that will run in the background until terminated in its stop function. This is because shared memory is initialized by the shm_start program, which terminates normally by itself (without being interrupted by SIGINT), and stopped by the shm_stop program, which terminates normally by itself as well.
Therefore, the shm_client start function calls execlp on the shm_start executable in the child process after the call to fork, which starts the shm_start function. The parent process then calls waitpid to wait for the child (shm_start) to finish, before returning. Similarly, the shm_client stop function calls execlp on the shm_stop executable in the child process after the call to fork, and the parent process waits for the child (shm_stop) to finish, before returning.
Crucially, in the start function, the parent calls shm_init after waiting for the child to finish. This allows the program using the shm_client to view the contents of shared memory by calling the print_shm function (useful in both the CLI and in tests). Without it, the print_shm function would generate a segmentation fault because the semaphores and shared memory blocks would not have been initialized yet. The following is a timeline of events for shm_client. Time passes from top to bottom, and the white boxes on the dotted lines indicate the time that the given entity is in existence / is being used. (runtime-docs/Shm-Client):
dev_handler_client exposes functions to connect and disconnect virtual devices. This is useful because we want to be able to test dev_handler without connecting and disconnecting actual Arduinos (ex: automated CI tests). For example, we can write a test that (1) connects a virtual device, (2) verifies that it is properly registered in shared memory, (3) disconnects the device, then (4) verifies that the device is no longer registered in shared memory.
Real Arduino devices are exposed as a "port", which can be interacted with like a normal file with open(), close(), read(), and write(). (Please read the dev handler wiki page!) There's no way to create a fake port in C. To create a virtual device, we instead leverage Unix domain sockets. While an Arduino device appears as a file with path /dev/ttyACM*, we can create a socket with path /tmp/ttyACM* to represent a virtual device. The asterisk follows the same numbering scheme as /dev/ttyACM*. (Again, see the dev handler wiki page.)
The process that uses the dev_handler_client function to connect a virtual device first creates the socket and waits for dev handler to recognize it as a device. Note that dev handler polls for both /dev/ttyACM* and /tmp/ttyACM*. Dev handler reads from and writes to one end of the socket. The calling process then forks itself; the child process executes virtual device code specific to the type of virtual device. This child process reads from and writes to the other end of the same socket that dev handler is reading from and written to. Remember that a socket has two ends; each end supports both reading and writing. Each end reads bytes that are written into from the opposite end. This child process communicates with dev handler through the socket using the lowcar protocol.
To replicate disconnecting an Arduino, the virtual device process is force-ably killed and the socket is removed.
While Arduinos are implemented in C++, virtual devices are implemented in C. This makes it easier to use these virtual devices in our test cases, which are also implemented in C.
Each virtual device file defines an enum of its parameters and a couple of functions that describe the behavior of that particular virtual device type. The enum order should match the order of the parameters defined in runtime_util.c! One function initializes the parameter values and another function describes how the virtual device's parameters change per action cycle. An action cycle is a specified interval at which zero or more parameter values change to mimic physical sensor values.
The aforementioned functions are passed to lowcar_protocol(), which takes care of communicating with dev_handler using the lowcar protocol.
| Arduino | Virtual Device | |
|---|---|---|
| File Type | Serial Port | Unix Domain Socket |
| File Path | /dev/ttyACM* | /tmp/ttyACM* |
| Device Language | C++ | C |
- Communicate using the lowcar protocol (either via serial port or Unix socket)
- Dev handler recognizes removal of the serial port (or Unix socket) file as a device disconnect
- File I/O functions on both sides.
read()/write()
One way to think about net_handler_client is it acts like a fake Dawn and fake Shepherd at the same time. Therefore, the net_handler_client needs to display all of the messages that it receives from Runtime to the screen in a human-readable way, as if it were Shepherd or Dawn. So, when net_handler_client first starts up net_handler, it waits for the process to start up, and then it connects to the Shepherd TCP, Dawn TCP, and Dawn UDP output ports from that net_handler process to capture all the outputs coming from Runtime.
After this is set up, any logs that are sent out by Runtime to be read by Dawn are captured by net_handler_client and outputted to the terminal—this is what you see when you use net_handler_cli. The same is true for challenge data messages sent out by Runtime to be read by Dawn or Shepherd—net_handler_client captures it all and outputs it to the screen. This is the output dumping mechanism of net_handler_client.
There are two problems with dumping everything that is received to the screen, however:
- If excessive logs are printed to the screen (perhaps due to test student code that was purposefully written to generate a lot of log messages), it would render the CLI basically unusable because messages would be printing out at an extremely high rate (making it impossible to enter in new commands), and it may break the tests because the output capturing mechanism may not be able to keep up with all of the data coming in on the logs (the time it takes to resize the output buffer would cause some output to be dropped or corrupted). Additionally, Travis has a hard limit on how long a build log can be; if student code generates 1000 logs in one second, that's 1000 logs in the Travis build log, which would probably break our build when the build log becomes too long.
- Once a gamepad state message is sent to Runtime on UDP, Runtime starts sending back UDP packets at around 100 Hz with device data. If we dumped all of the received device data messages on UDP to the screen as they came, the same problems described in the first case would apply. Basically,
net_handler_clientwould generate too much output. These two points are why we have the output suppression mechanism, so that we don't see all of the output when usingnet_handler_clior when writing tests.
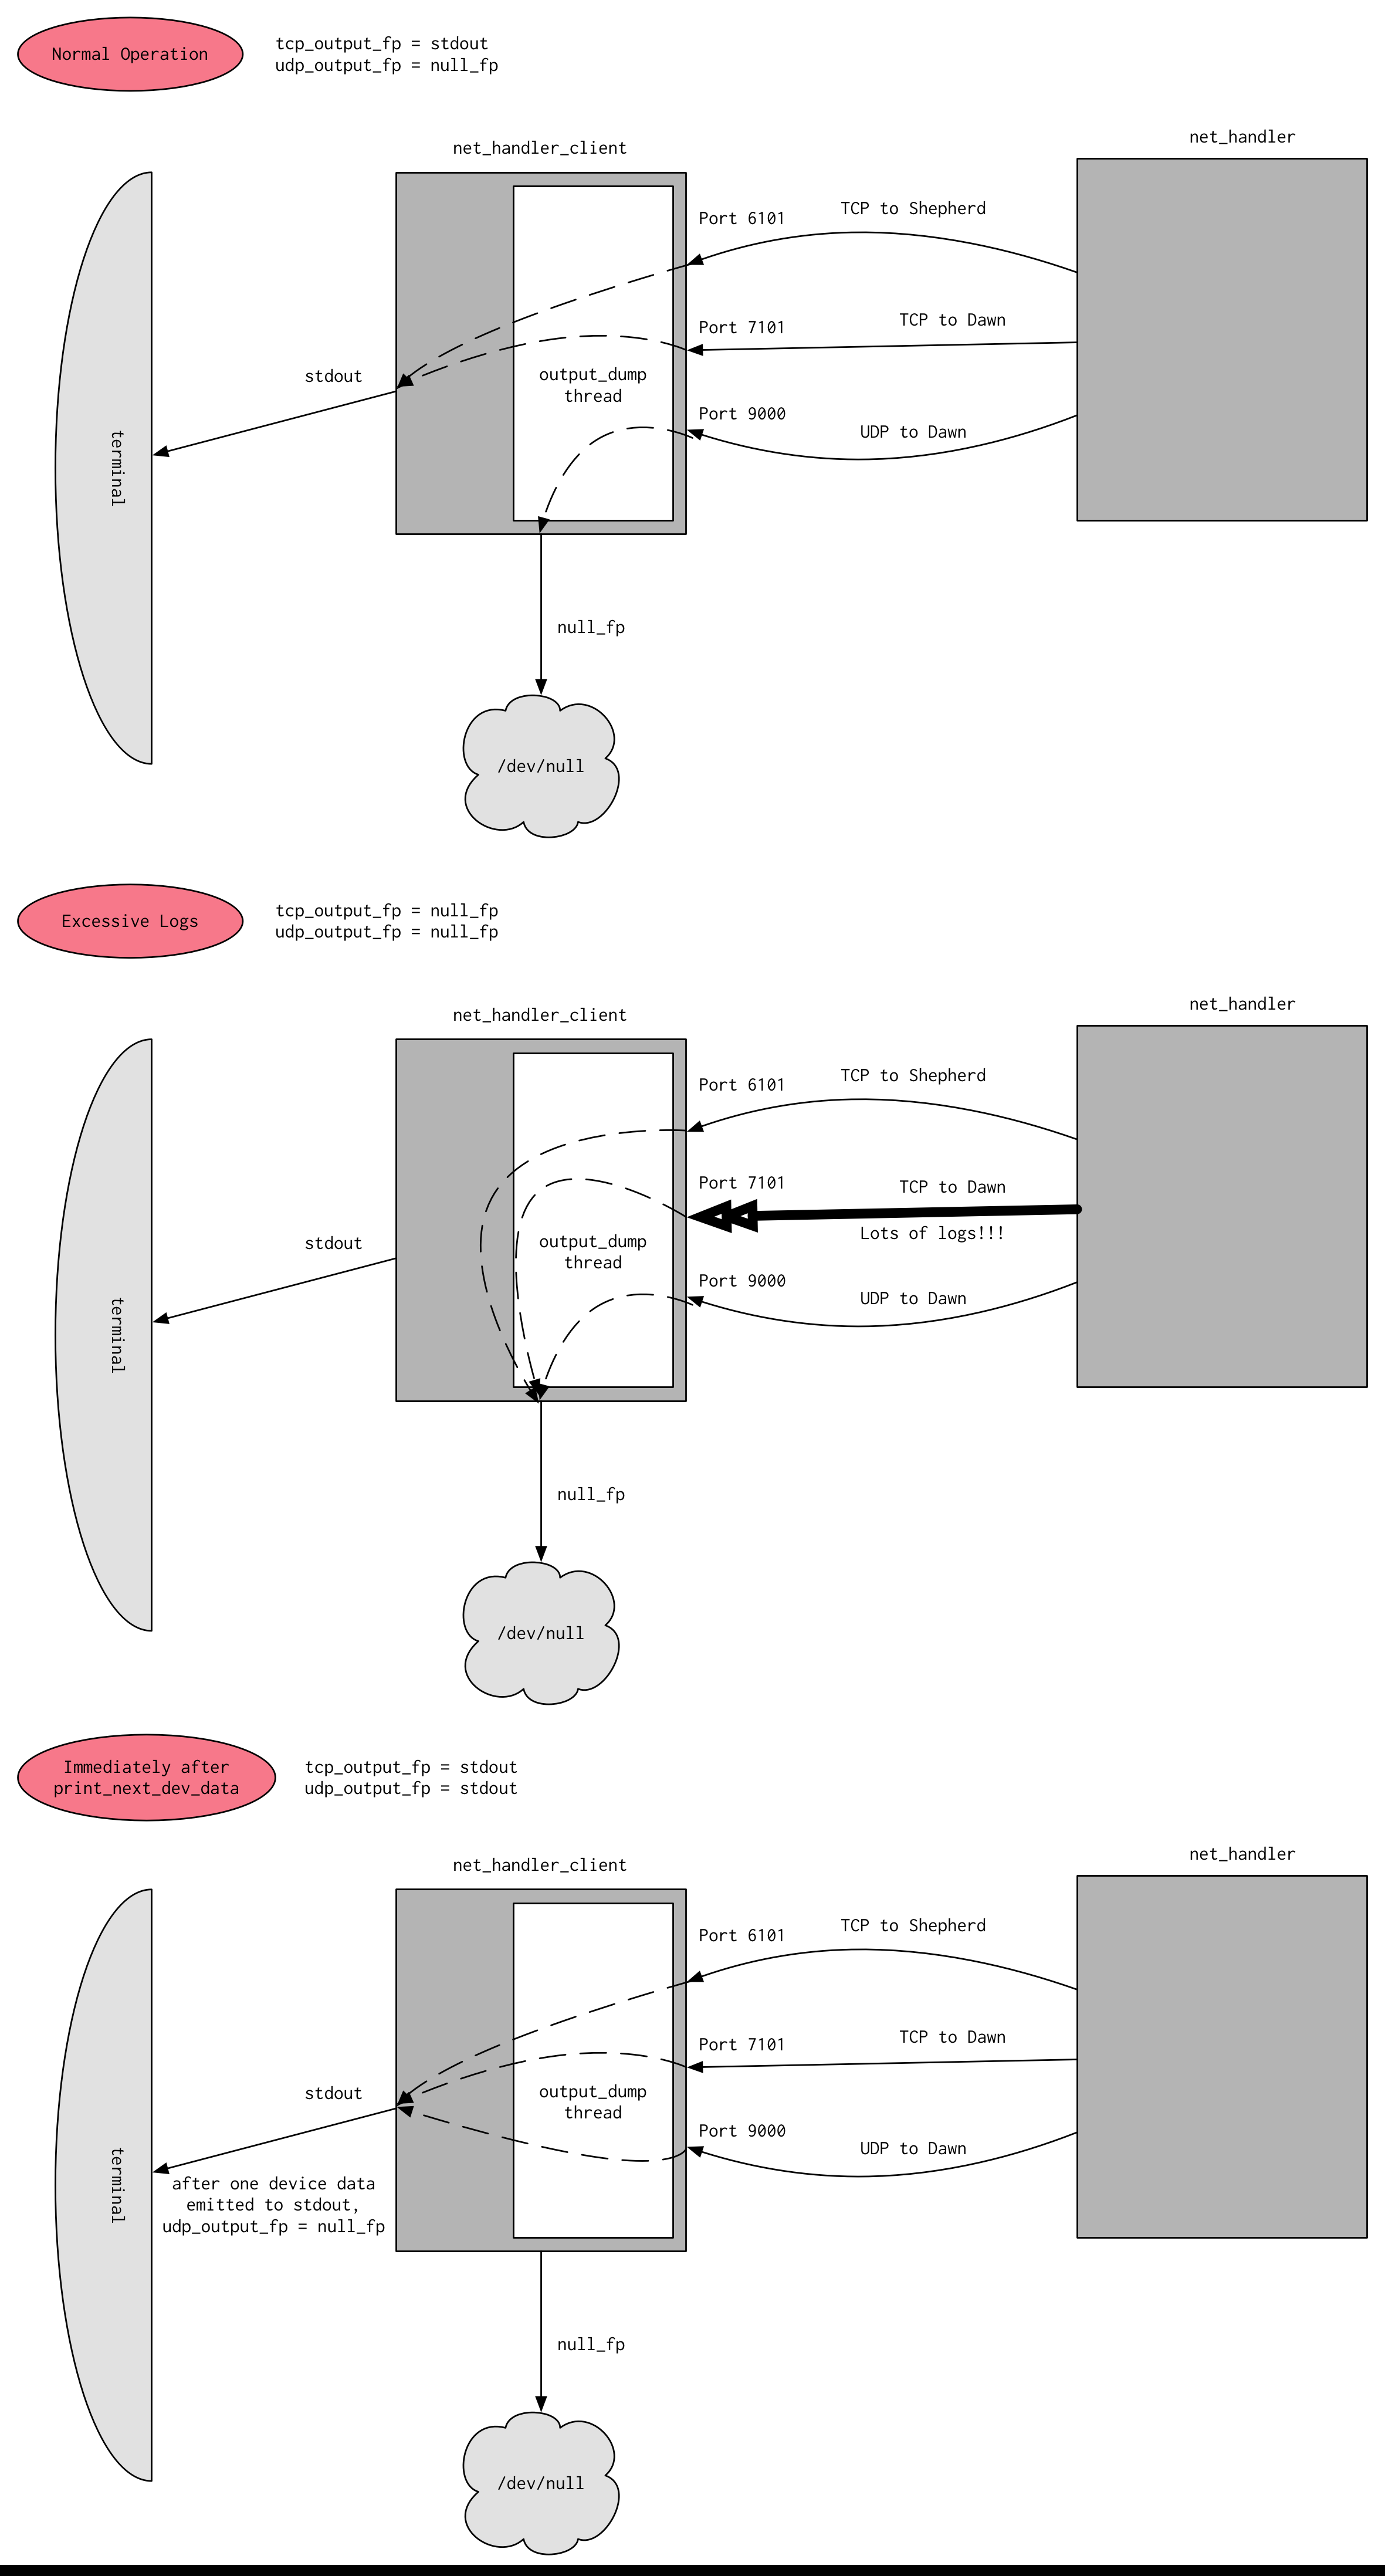
Output suppression is done by having two file pointers to output locations open at any given time: one to standard output (stdout), and the other to /dev/null, which is a dummy file on your system that you can write to that won't save any of the data (think of it as basically a garbage can where you can write unneeded data to get rid of it). When we need to suppress output, we direct output to /dev/null, and when we want to view output, we direct it to stdout. By default, UDP output is suppressed (because net_handler sends device data to Dawn at around 100 Hz, which we don't want to see by default) and TCP output is enabled (because we only want to suppress output when we get excessive numbers of logs from the system, otherwise we want to see it).
The condition for suppressing TCP output is controlled by the three constants in the output_dump function in net_handler_client: sample_size, disable_threshold, and enable_threshold. If sample_size number of logs, all within disable_threshold milliseconds of each other arrive from Dawn, then TCP output will be suppressed. TCP output is only enabled again when the time between two incoming TCP messages is larger than enable_threshold.
The way to enable UDP output is by calling the print_next_dev_data function in net_handler_client. What this will do is set a lock-protected global flag to 1. This causes the output location for UDP to be temporarily set to stdout. Once the next UDP packet arrives from Dawn, it is printed to the screen; then the output location for UDP is immediately set back to point at /dev/null and the lock-protected global flag set back to 0 to continue suppressing output.
Below is a diagram that helps visualize the output suppression mechanism (runtime-docs/Net-Client-Output-Suppression.png):
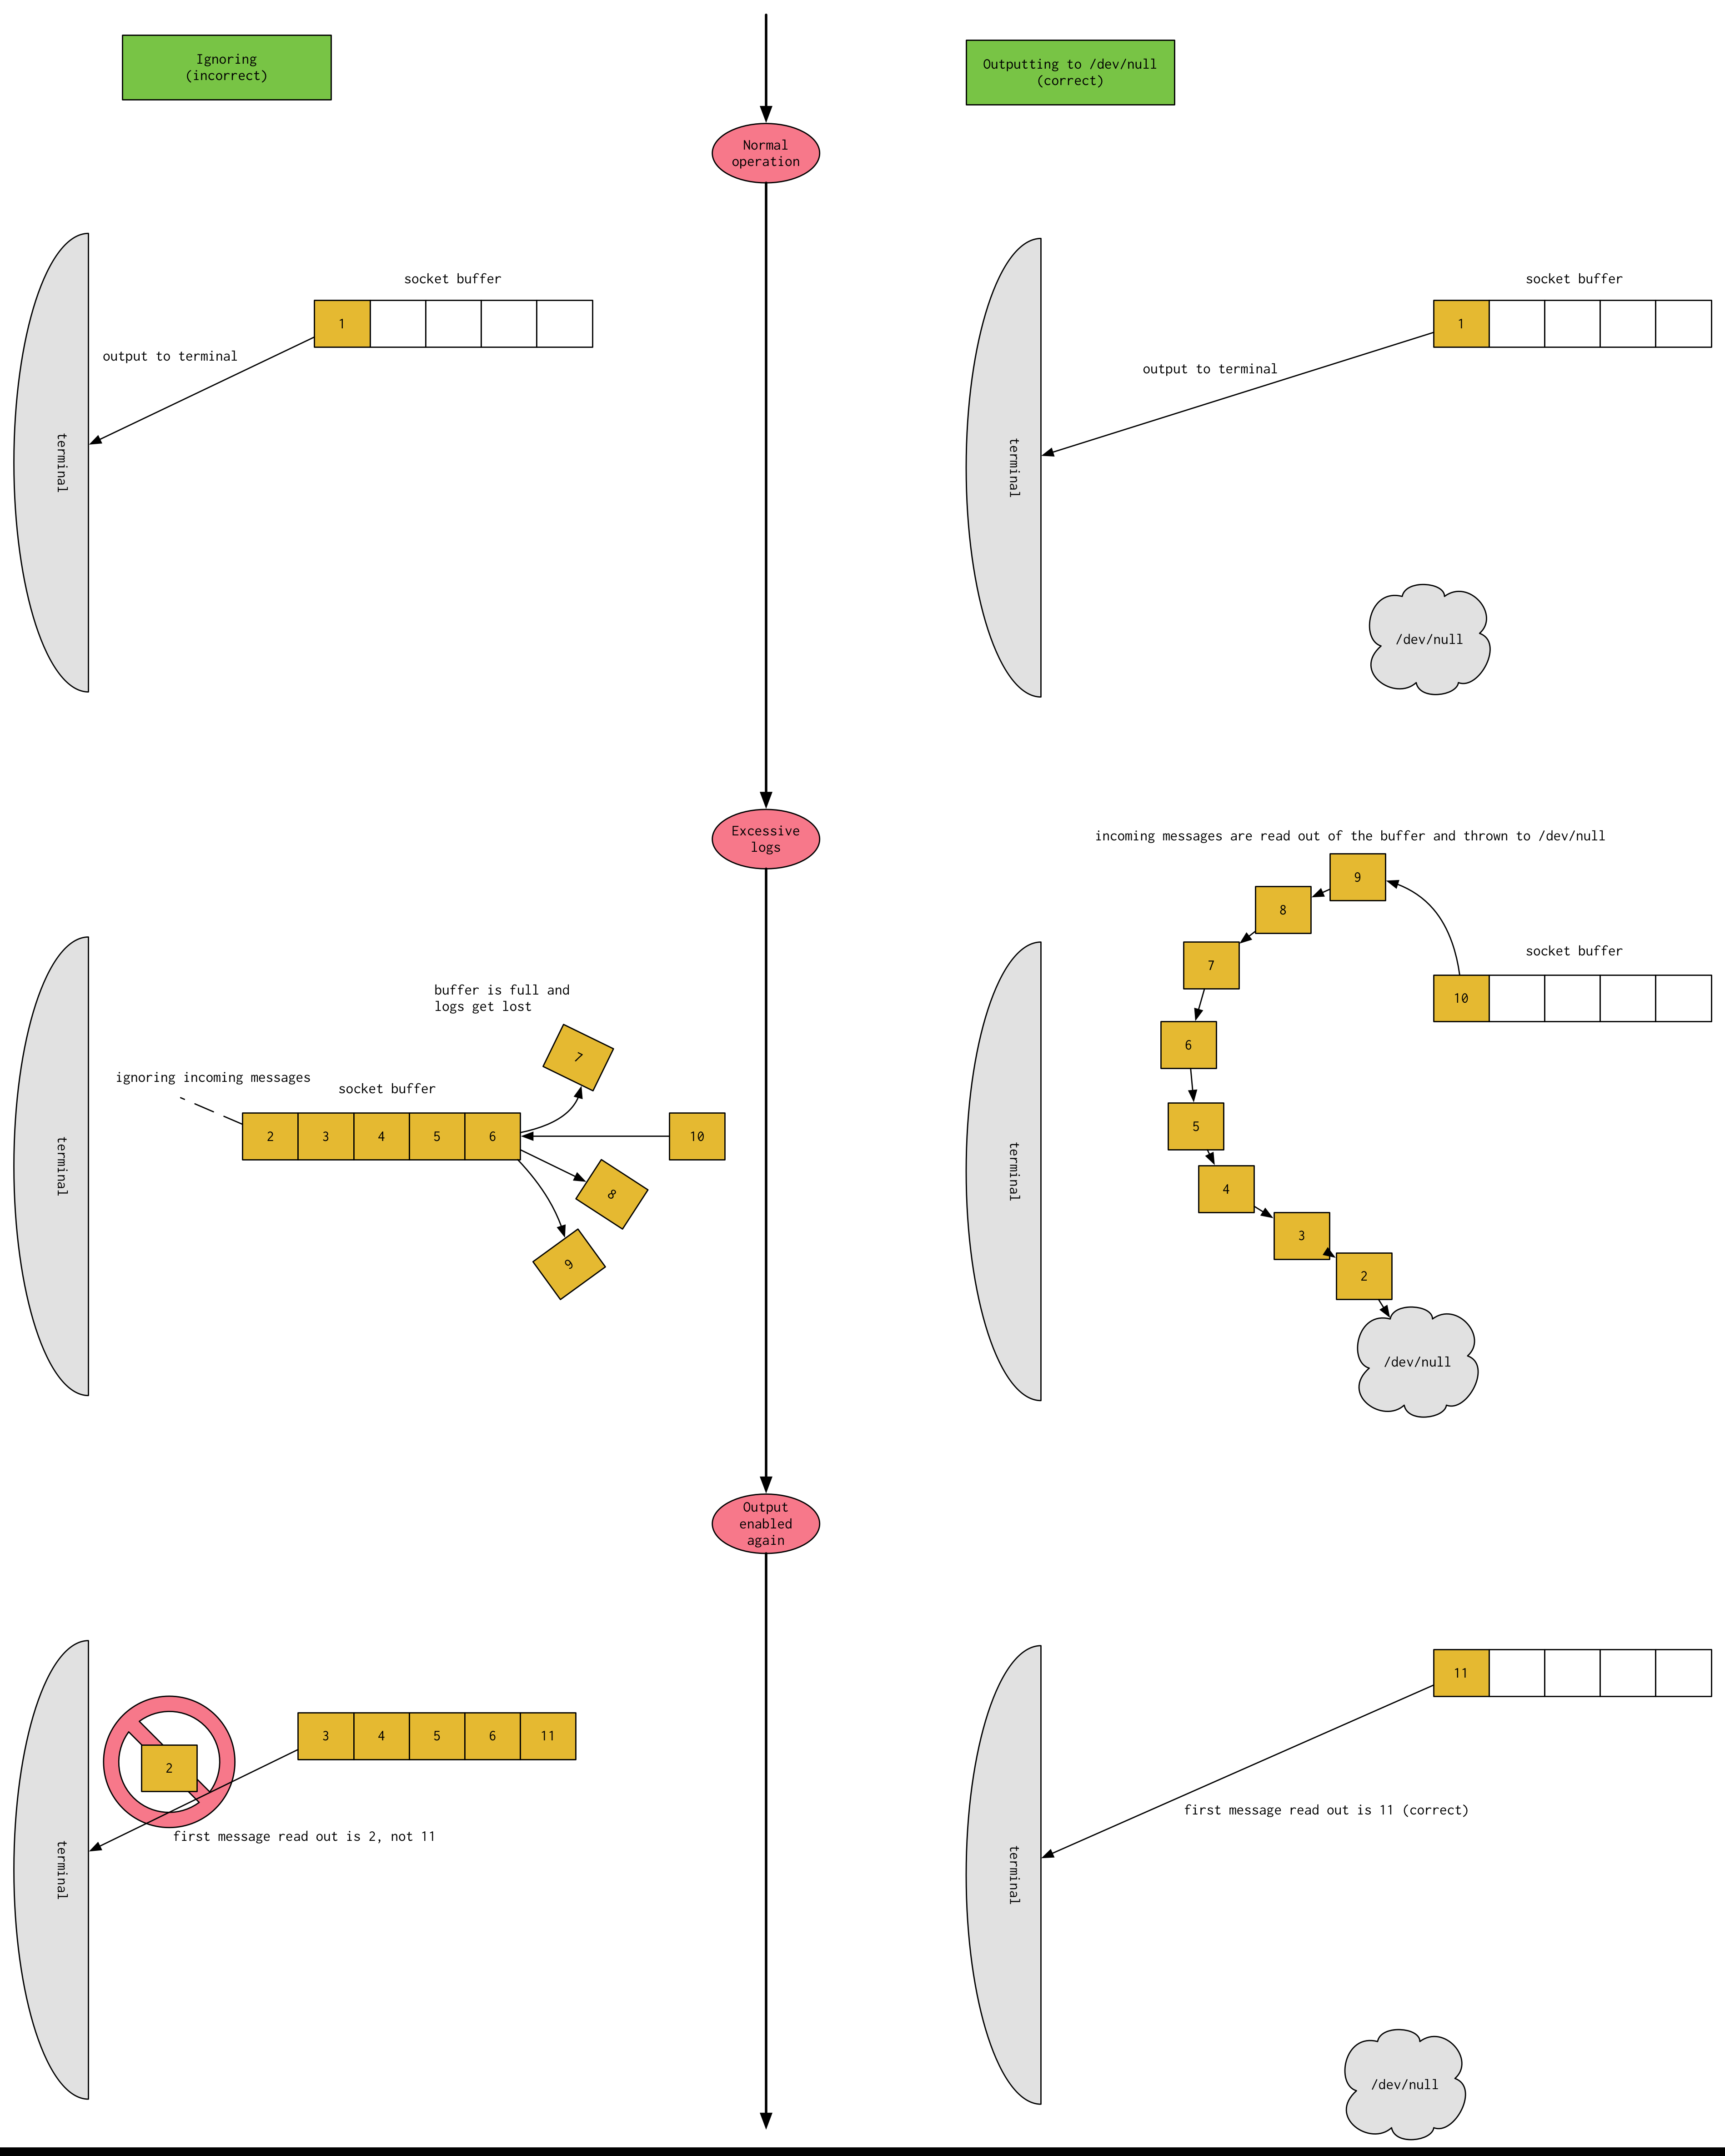
One last point to make. You may wonder why output suppression has to write to /dev/null, i.e. why don't we just ignore the messages coming in on a socket when we want to suppress output? The answer lies in a very subtle implementation detail of sockets. Basically, when messages arrive on sockets, they arrive asynchronously—the program that is using that socket on the machine has no control over when data will arrive on the socket. Therefore, the data is first stored by the operating system in a temporary buffer, so when the program calls read on the socket, the operating system can feed the data in that temporary buffer to the program.
If we simply ignore all input coming from the socket when we want to suppress output, the temporary buffer would quickly fill and incoming data would no longer be able to be put into the buffer. Moreover, when output becomes enabled again, what we read is NOT the most recent data to arrive on the socket. We would be reading the first message that was suppressed out from the temporary buffer, which is not what we want. So, we have to constantly be reading any incoming data from the socket out of that temporary buffer, even when we are suppressing output. It's just that when we suppress output, we don't want to read the data out and send it out stdout to be printed. We must dump that data that we read out to /dev/null to get rid of it.
Below is a diagram explaining the difference between the two approaches: ignoring when suppressing output (incorrect) and reading out and dumping to /dev/null to suppress (correct) (runtime-docs/Dump-To-Dev-Null):
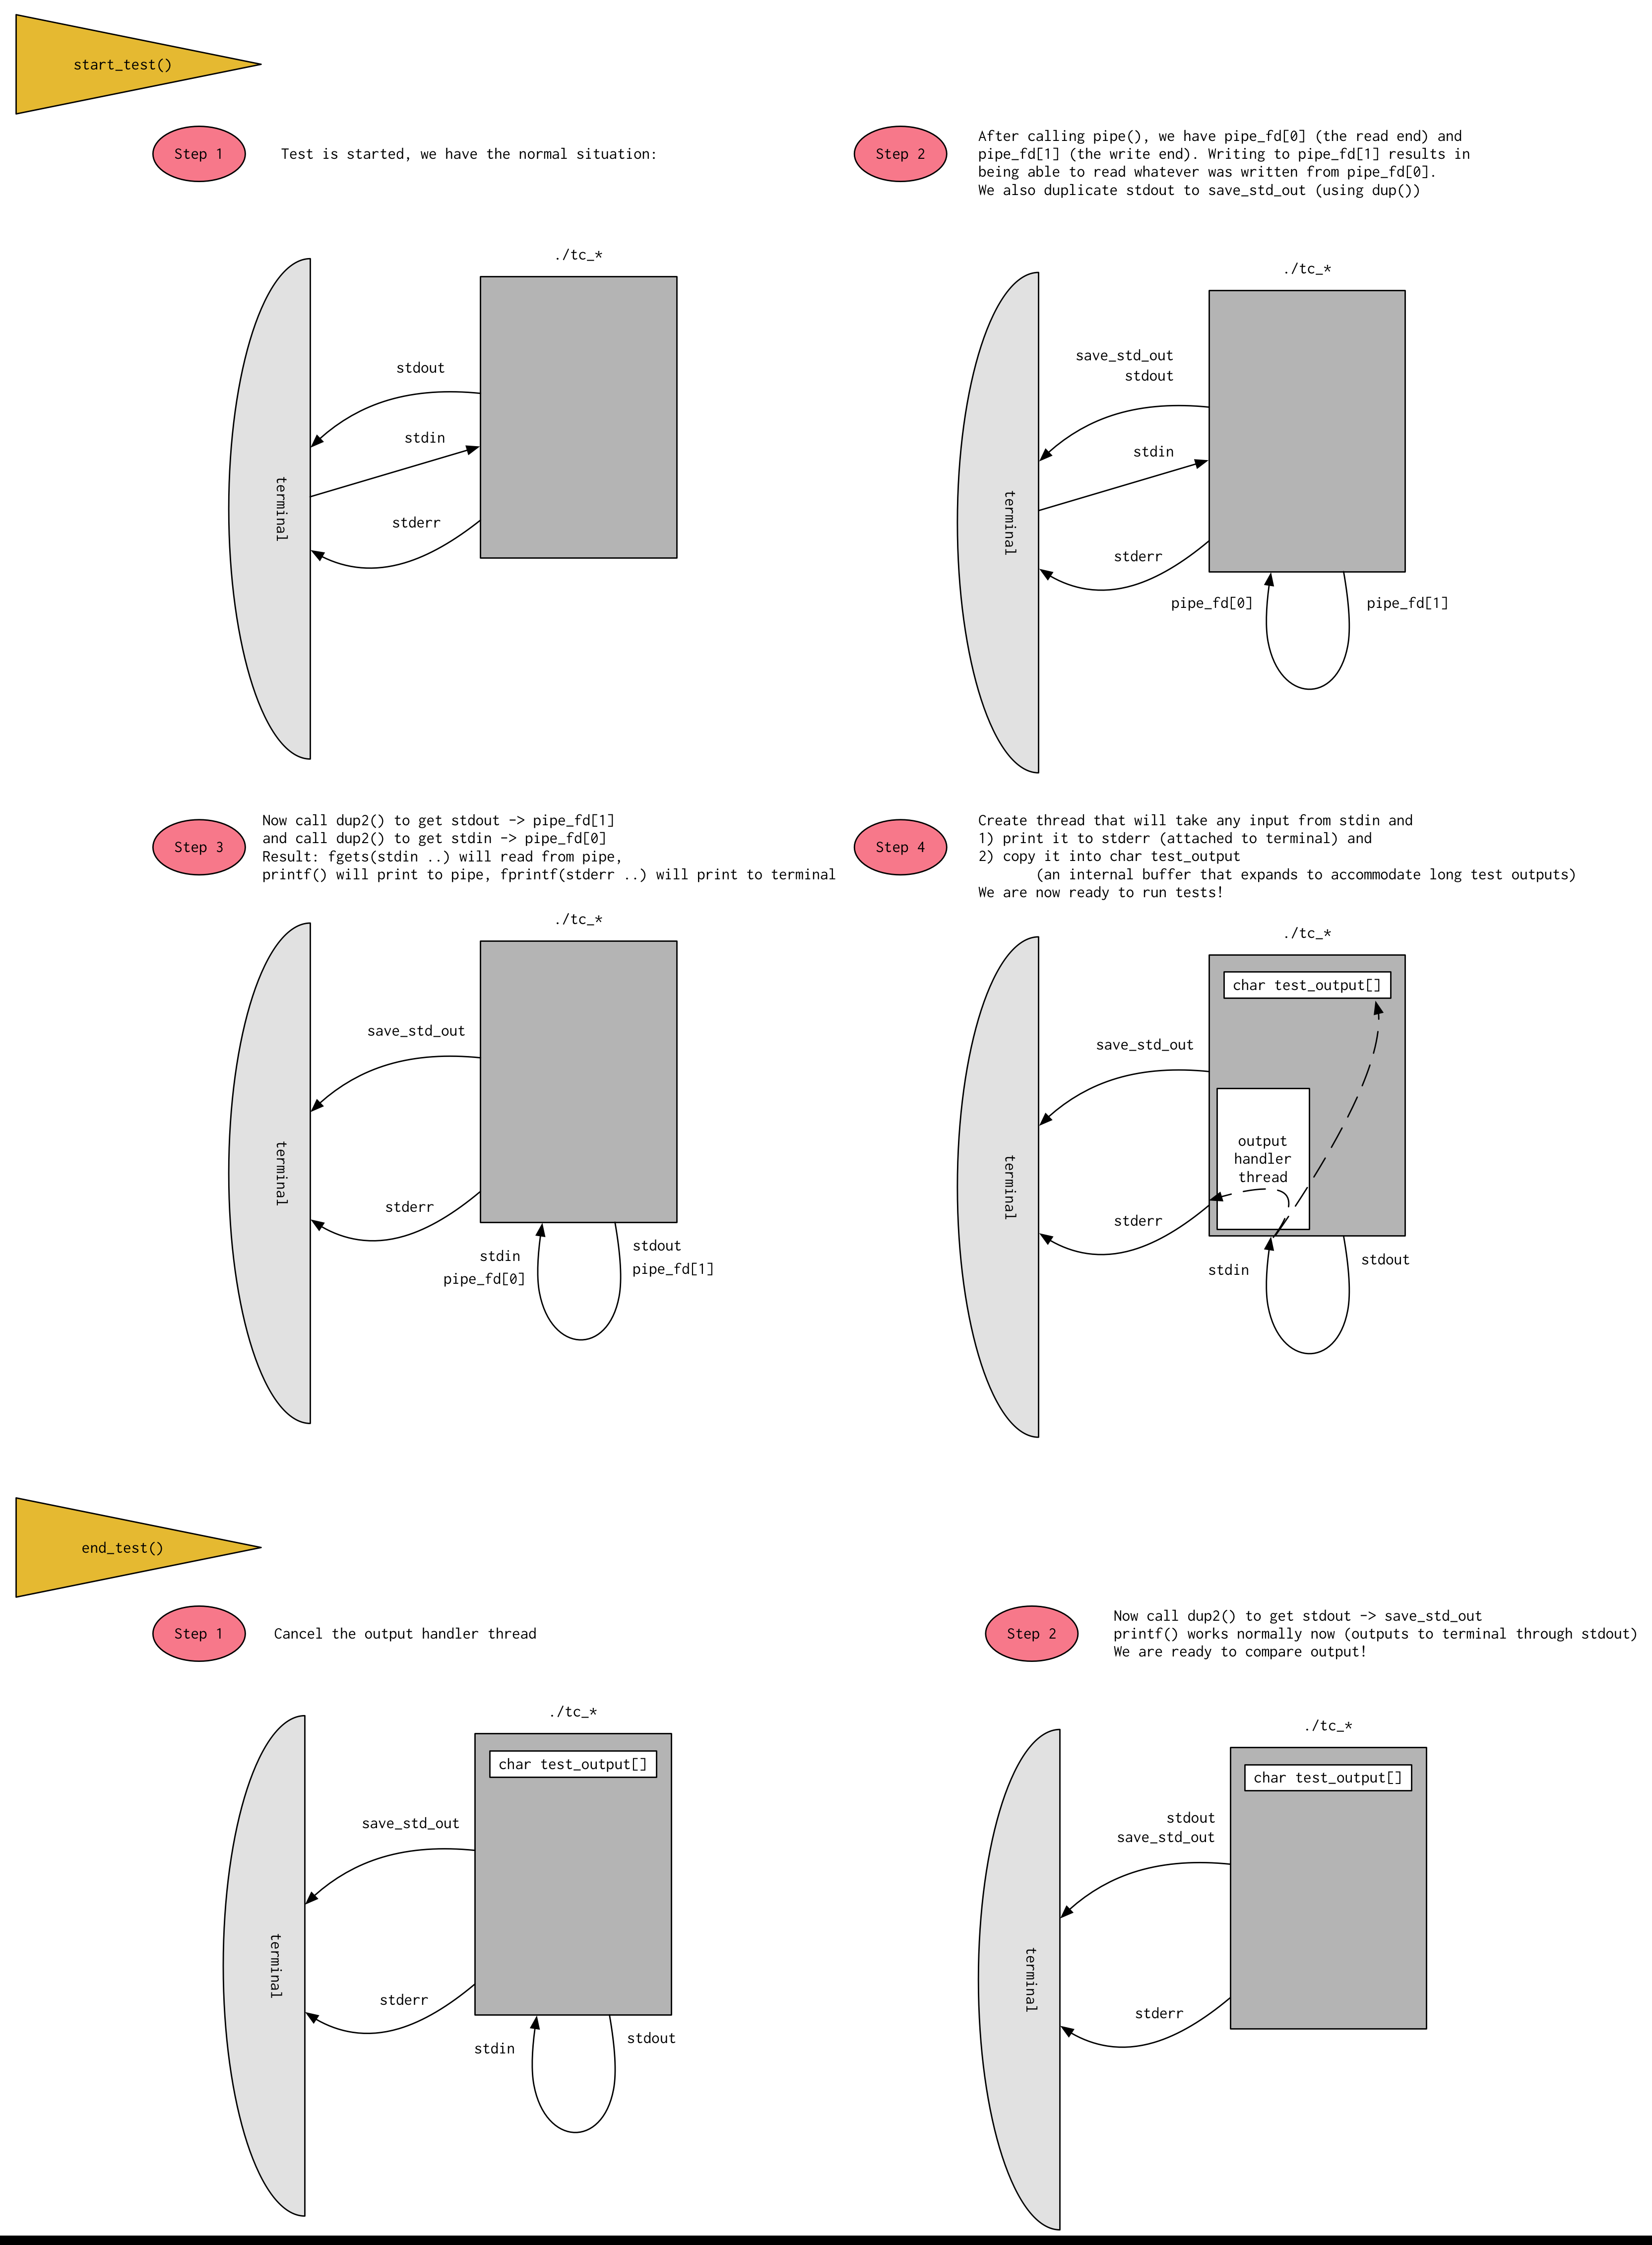
Recall that in order to actually verify that the series of inputs given in a test are resulting in the proper behavior of the system, we need to be able to "record" the output generated by Runtime during the test and save it for comparison at some later point. It would also be useful if the output of the test was recorded while also being output to the screen, so that someone running the test can observe the output of the test in real time. This is trickier than it sounds, and is best shown with a diagram. The setup to make this all work is done in the start_test function in test.c. At the conclusion of the test, input and output are returned to normal in the end_test function in test.c.
The key to getting the output to still go to the terminal is that after we send stdout to the write end of the pipe, stderr stays attached to the terminal, which we can then use to print things to the terminal while stdout pointing at the write end of the pipe.
If you are unfamiliar with pipes, please read the wiki page on pipes first.
(runtime-docs/Test-Output-Redirect-Logic.png):