The card game War, a favorite among people who don't particularily want to think and would also like to spend a long time playing a card game, is played with the following rules, courtesy of Bicycle Cards:
- The deck is shuffled, and evenly split between two players.
- Each player places a card face up.
- The player with the higher card takes both cards. If the cards have the same numerical value, a war begins.
- In a war, each player places one card face down, and another card face up. The player with the higher of these last two face-up cards wins the war, and takes all six cards. If these cards are also the same, the same war process repeats.
- After all possible cards have been played, each player shuffles their won cards back into their hand.
After (part of) a game of war with my girlfriend, I decided to try to simulate the game, and see if anything interesting was going on. To put a long-story short, it's remarkable insofar as it's surprising how truly random the game is, more than anything else.
We create a metric called "score", which is found by summing the numerical value of every card in a player's hand at the initial deal. Comparing this score, we may expect the higher score to lead to an increased win probability.
Over 50,000 games simulated, the higher initial score led to victory 24,789 times, and the lower score victory 25,211 times. I attribute this entirely to statistical noise rather than any other factors.
Though it's possible a more intelligent scoring mechanism could better predict which player would be the winner, that was outside of the scope of this project.
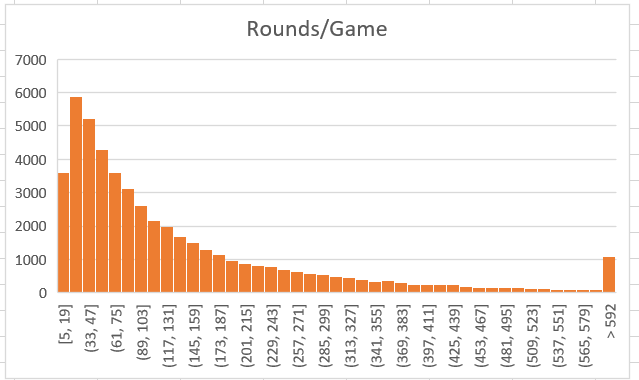
I created a histogram with the number of rounds per game as the metric using Excel. Here's the result:
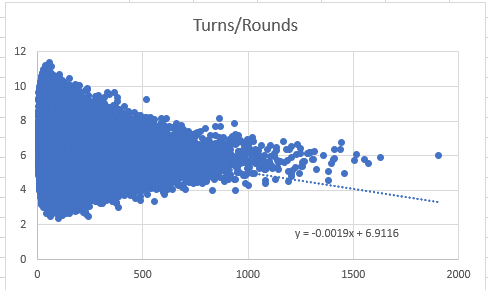
Here's a very-similar looking chart - a histogram of turns per game, also created in Excel.
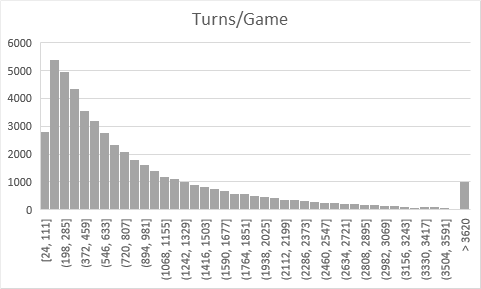
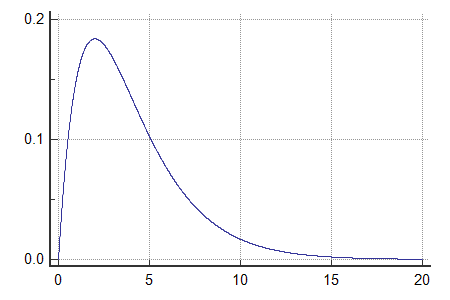
Though I don't have enough data science knowledge yet to delve too deep into these functions, they look almost exactly like a Chi-Squared distribution.
Interestingly, the average number of turns per round looks exactly like a standard normal curve.
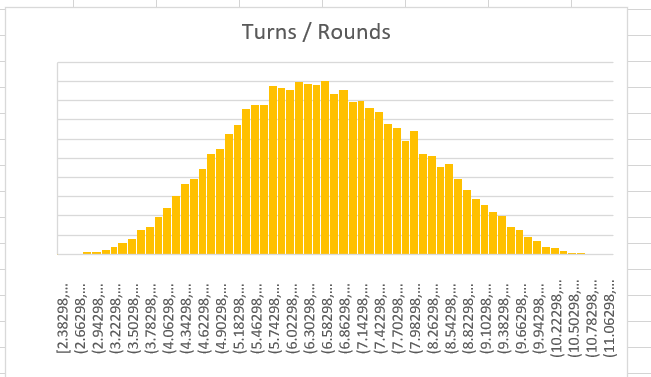
However, as games get longer, average round length (in turns) tends to decrease. It's relativey difficult to see this in the chart, so I added a trendline to help illustrate this. The real trendline is certainly not linear, but exposing a linear trendline helps to show the direction of the data in a solid mass of 500,000 blue data points.
A key question I was wondering was how the expected number of rounds changes as a function of deck size. I created a 3 dimensional histogram using Wolfram Mathematica, with bucket size on the X axis, deck size on the Y axis, and count on the Z axis. This produced the following image:
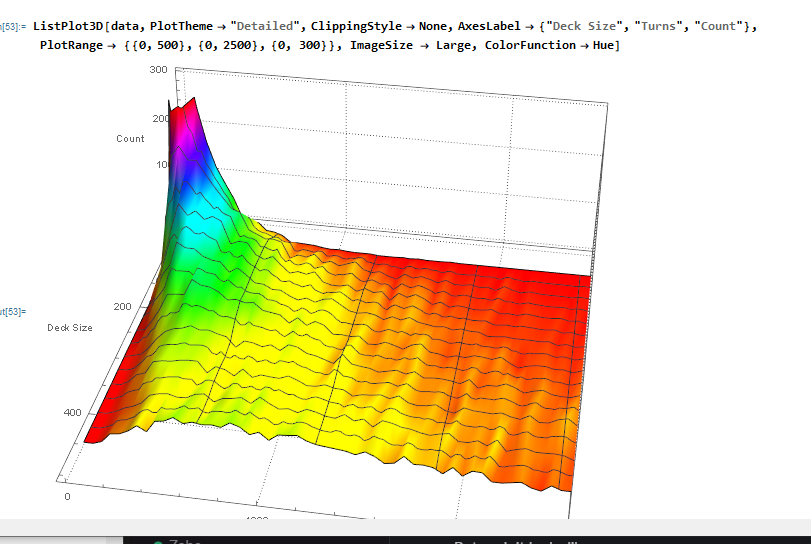
This image was created with 2500 games per deck size, at sizes ranging from 48 to 500 cards.
An image is included in the repository of the same image at a lower game resolution, which shows a similar (albeit harder to read) result.
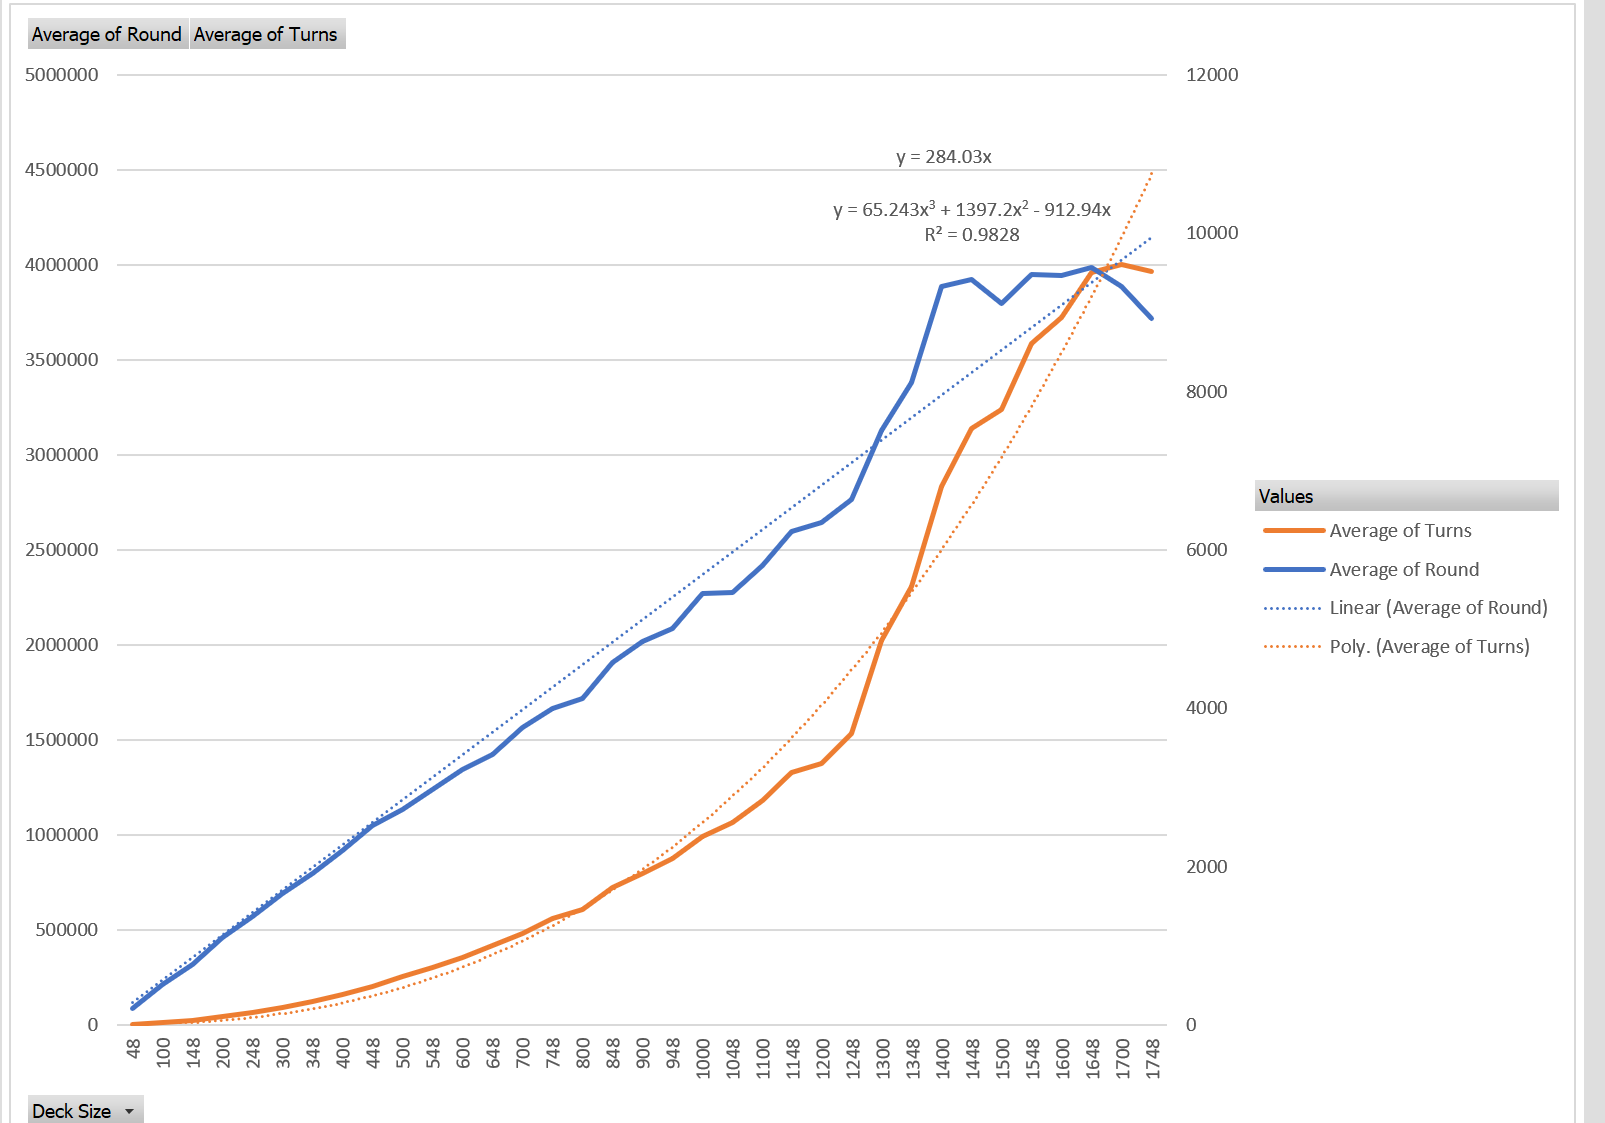
We plot the average number of turns per game and the average number of rounds per game as a function of deck size, ranging from 48 cards to 1748, in increments of 50. 2500 games were run at each deck size, for a total number of games run of 86,970.
The number of rounds per game appears to be linear, and the number of turns per game appears to be O(n^3). Both of these analysis were done by looking at the graph, and adjsting the trendline on Excel until it looked about right.
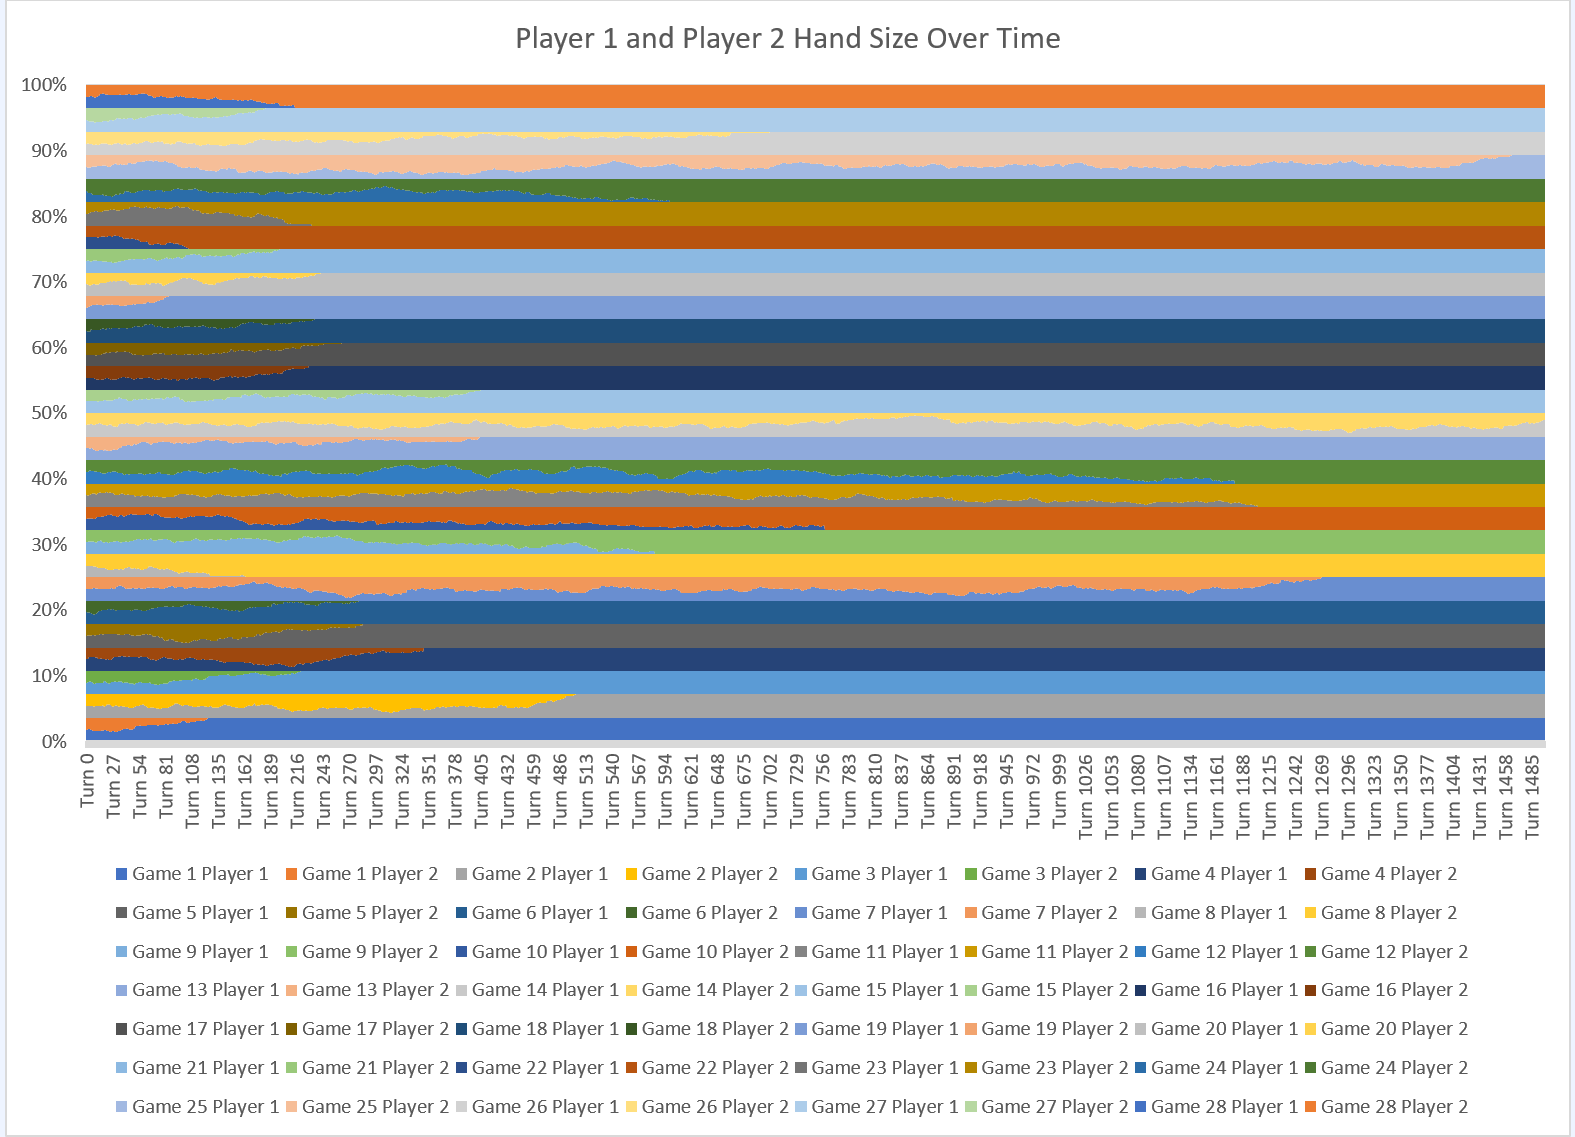
A 100% stacked area chart showing both Player 1 and Player 2 handsize was chosen for maximum readability.
Result for a 52 card deck with 4 suits, tracking 28 games over 1,500 turns:
Result for a 208 card deck with 4 suits, tracking 10 games over 20,000 turns:

Result for a 208 card deck with 16 suits, tracking 10 games over 20,000 turns:
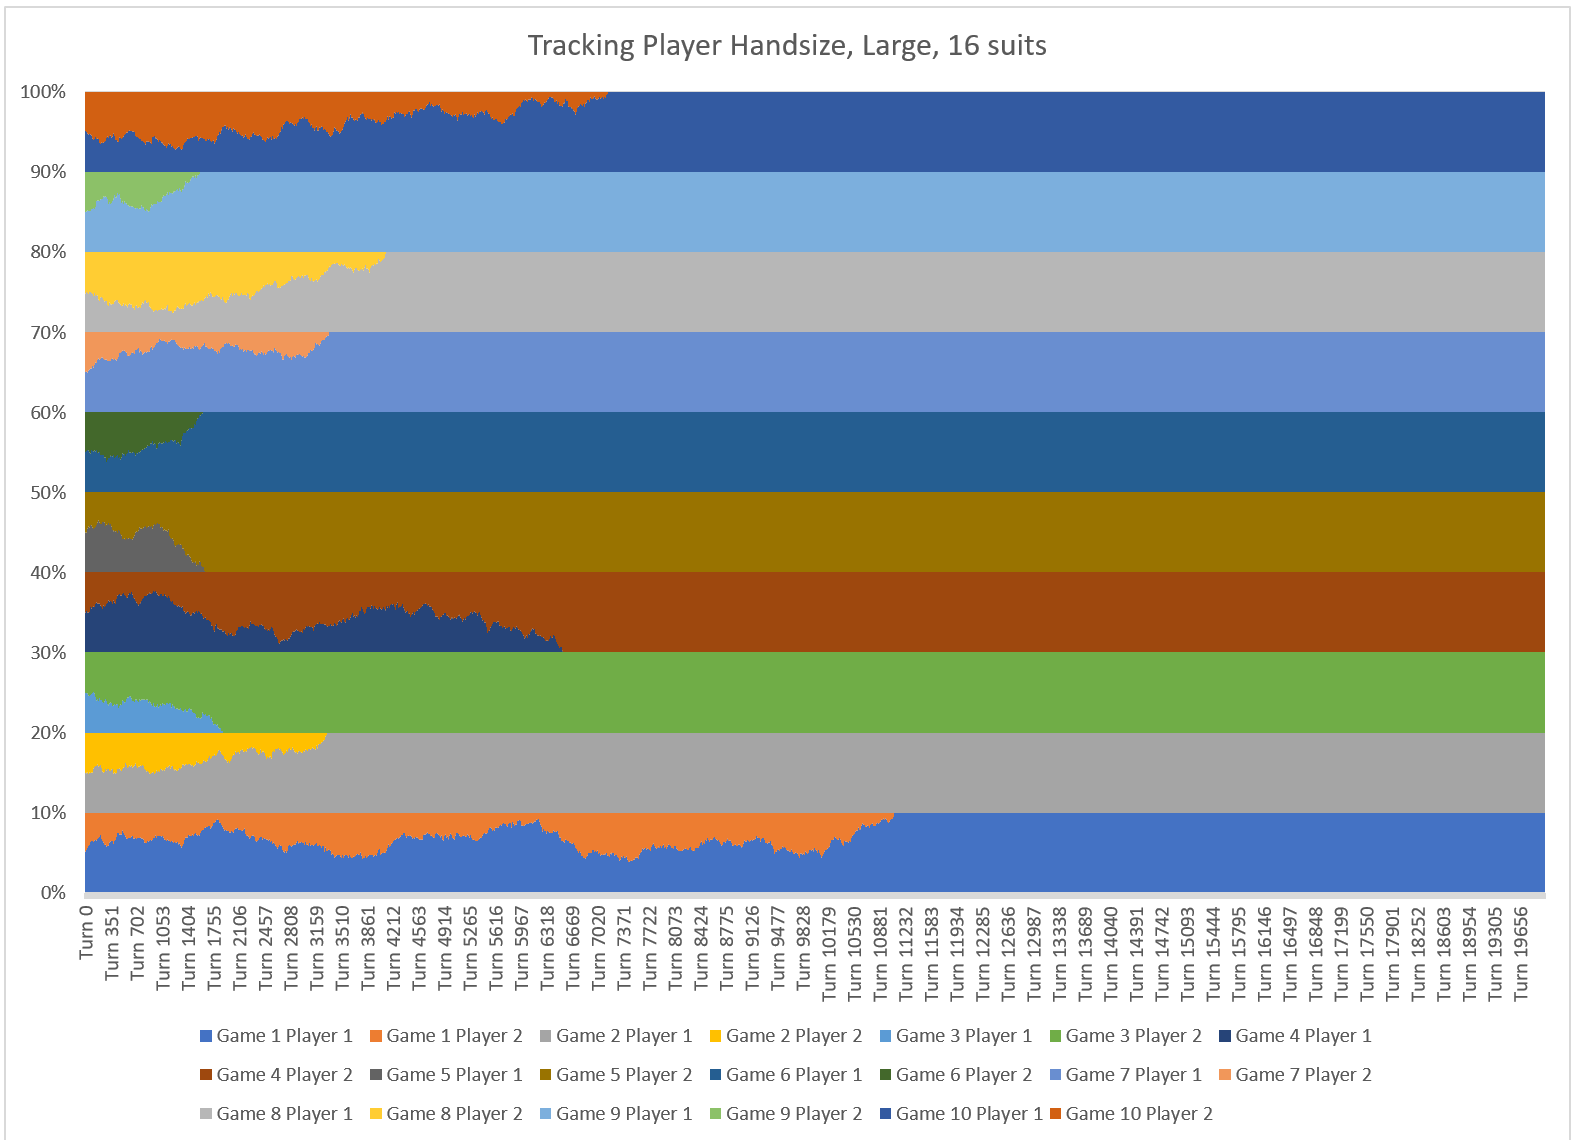
Note that with more suits, it's more likely that players enter a "WAR" scenario, leading to a greater average turn to turn number of cards exchanged. Thus, we see that the greater the number of suits (and thus the greater the number of cards with the same numeric value), the shorter the average game.
Note that the 208/16 situation still takes significantly longer than the 52/4 situation, so the only real way to make a war game go faster is to use fewer cards.
This project is primarily intended purely as an academic curiosity for myself, as well as providing a neat project to learn C++ with. The only difference between stupidity and science is writing it down, so I wrote it down :).
The project was built in Visual Studio. It's currently configured in such a way to produce turn by turn outputs of player's card counts - the other graphs were produced with direct changes to source, rather than a proper configuration system.