![]()


This REANA reproducible analysis example demonstrates a RECAST analysis using ATLAS Analysis Software Group stack.
Making a research data analysis reproducible basically means to provide "runnable recipes" addressing (1) where is the input data, (2) what software was used to analyse the data, (3) which computing environments were used to run the software and (4) which computational workflow steps were taken to run the analysis. This will permit to instantiate the analysis on the computational cloud and run the analysis to obtain (5) output results.
The analysis takes the following inputs:
dxaodinput ROOT filediddataset ID e.g. 404958xsec_in_pbcross section in picobarn e.g. 0.00122
The event selection code for this analysis example resides under the eventselection subdirectory. It uses the official analysis releases prepared by the ATLAS Analysis Software Group (ASG).
eventselection/CMakeLists.txteventselection/MyEventSelection/CMakeLists.txteventselection/MyEventSelection/MyEventSelection/MyEventSelectionAlg.heventselection/MyEventSelection/Root/LinkDef.heventselection/MyEventSelection/Root/MyEventSelectionAlg.cxxeventselection/MyEventSelection/util/myEventSelection.cxx
The statistical analysis code for this analysis example resides in statanalysis subdirectory. It implements limit setting for outputs produced by the event selection package.
statanalysis/data/background.rootstatanalysis/data/data.rootstatanalysis/make_ws.pystatanalysis/plot.pystatanalysis/set_limit.py
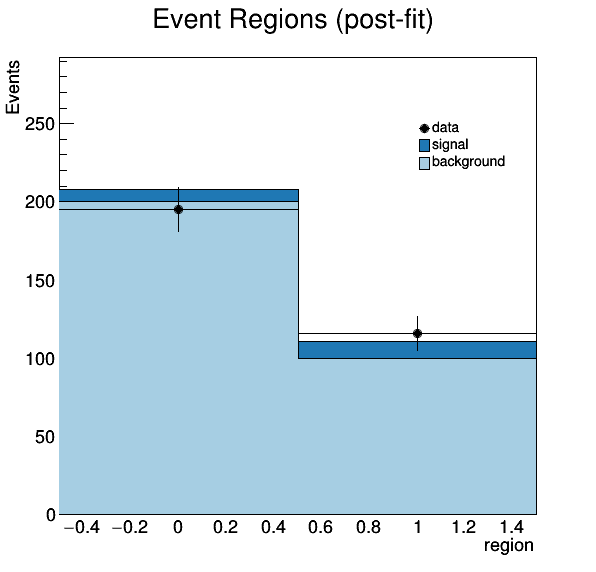
Notes that make_ws.py script generates a HistFactory configuration based on signal,
data and background ROOT files. It performs a simple HistFactory-based fit based on a
single channel (consisting of two bins).
In order to be able to rerun the analysis even several years in the future, we need to "encapsulate the current compute environment", for example to freeze the ATLAS software version our analysis is using. We shall achieve this by preparing a Docker container image for our analysis steps.
The event selection stage uses official ATLAS atlas/analysisbase container on top of
which we add and build our custom code:
$ less eventselection/Dockerfile
FROM docker.io/atlas/analysisbase:21.2.51
ADD . /analysis/src
WORKDIR /analysis/build
RUN source ~/release_setup.sh &&  \
    sudo chown -R atlas /analysis && \
    sudo chmod -R 775 /analysis && \
    sudo chmod -R 755 /home/atlas && \
    cmake ../src && \
    make -j4
USER root
RUN sudo usermod -G root atlas
USER atlas
We can build our event selection analysis environment image and give it a name
docker.io/reanahub/reana-demo-atlas-recast-eventselection:
$ cd eventselection
$ docker build -t docker.io/reanahub/reana-demo-atlas-recast-eventselection .
The statistical analysis stage also extends atlas/analysisbase by the custom code:
$ less statanalysis/Dockerfile
FROM docker.io/atlas/analysisbase:21.2.51
ADD . /code
RUN sudo sh -c "source /home/atlas/release_setup.sh && pip install hftools==0.0.6"
USER root
RUN sudo usermod -G root atlas && sudo chmod -R 755 /home/atlas && chmod -R 775 /code
USER atlas
We can build our statistical analysis environment image and give it a name
docker.io/reanahub/reana-demo-atlas-recast-statanalysis:
$ cd statanalysis
$ docker build -t docker.io/reanahub/reana-demo-atlas-recast-statanalysis .
We can upload both images to the DockerHub image registry:
$ docker push docker.io/reanahub/reana-demo-atlas-recast-eventselection
$ docker push docker.io/reanahub/reana-demo-atlas-recast-statanalysis
(Note that typically you would use your own username such as johndoe in place of
reanahub.)
This analysis example consists of a simple workflow where event selection is run first and its output serve as an input for the statistical analysis.
We shall use the Yadage workflow engine to express the computational steps in a declarative manner:
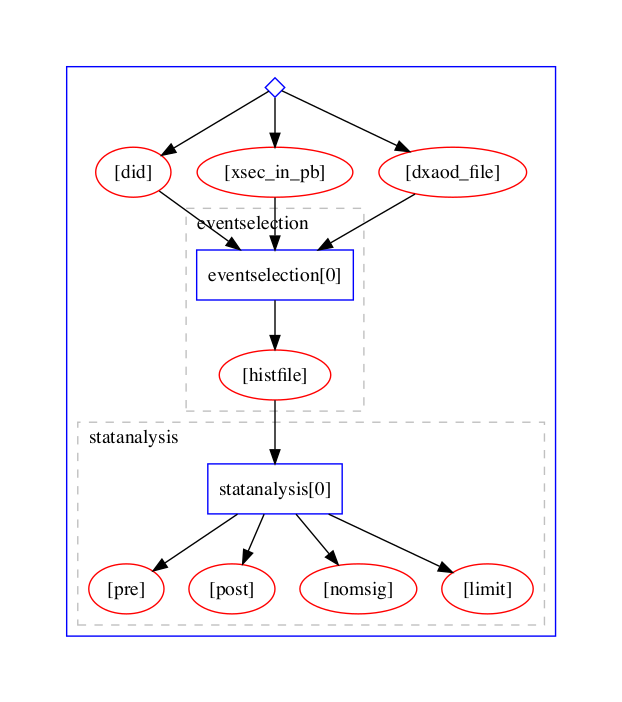
The full analysis pipeline is defined in workflow.yml and the individual steps are defined in steps.yml.
The analysis produces several pre-fit and post-fit plots:

The limit plot:
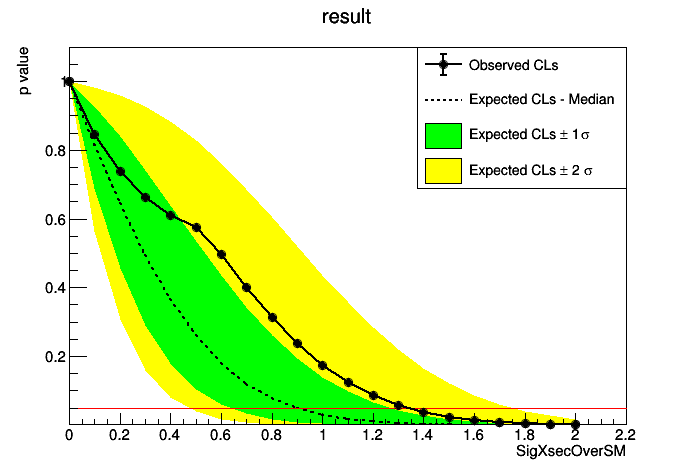
The limit data is also stored in JSON format for both an entire µ-scan as well as for µ=1.
There are two ways to execute this analysis example on REANA.
If you would like to simply launch this analysis example on the REANA instance at CERN and inspect its results using the web interface, please click on the following badge:
If you would like a step-by-step guide on how to use the REANA command-line client to launch this analysis example, please read on.
We start by creating a reana.yaml file describing the above analysis structure with its inputs, code, runtime environment, computational workflow steps and expected outputs:
version: 0.3.0
inputs:
  parameters:
    did: 404958
    xsec_in_pb: 0.00122
    dxaod_file: https://recastwww.web.cern.ch/recastwww/data/reana-recast-demo/mc15_13TeV.123456.cap_recast_demo_signal_one.root
workflow:
  type: yadage
  file: workflow/workflow.yml
outputs:
  files:
    - outputs/statanalysis/fitresults/pre.png
    - outputs/statanalysis/fitresults/post.png
    - outputs/statanalysis/fitresults/limit.png
    - outputs/statanalysis/fitresults/limit_data.json
We can now install the REANA command-line client, run the analysis and download the resulting plots:
$ # create new virtual environment
$ virtualenv ~/.virtualenvs/reana
$ source ~/.virtualenvs/reana/bin/activate
$ # install REANA client
$ pip install reana-client
$ # connect to some REANA cloud instance
$ export REANA_SERVER_URL=https://reana.cern.ch/
$ export REANA_ACCESS_TOKEN=XXXXXXX
$ # create new workflow
$ reana-client create -n myanalysis
$ export REANA_WORKON=myanalysis
$ # upload input code, data and workflow to the workspace
$ reana-client upload
$ # start computational workflow
$ reana-client start
$ # ... should be finished in about a minute
$ reana-client status
$ # list workspace files
$ reana-client ls
$ # download output results
$ reana-client download
Please see the REANA-Client documentation for
more detailed explanation of typical reana-client usage scenarios.