Debugging Unit Tests
With Chutzpah when your unit tests are not passing or working as expected you have a few different options for debugging them.
The best and most consistent way to debug JS unit tests is to open them in a browser and use the browser's built in developer tools. There are a few ways to do this with Chutzpah. If you are using the command line executable you can run:
chutzpah.console.exe myTest.js /openInBrowser
This will launch the test in the default browser. You can also specify the browser you want (either IE, Chrome or Firefox):
chutzpah.console.exe myTest.js /openInBrowser firefox
If you are using the Chutzpah Context Menu extension you can launch the test in a browser from the right-click menu.
Chutzpah is able to generate a detailed trace log to help troubleshoot issues. Running
chutzpah.console.exe myTest.js /trace
Generates a chutzpah.log file which will have details about everything chutzpah tried to do.
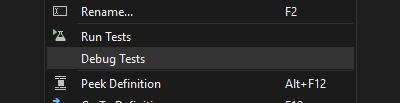
If you are using either of the Chutzpah Visual Studio extensions you can also (as of version 4.1.0) debug your JS tests from inside of the IDE. You can set breakpoints in your JS files and launch using the Visual Studio Debugger by clicking:
Debug Tests when using the Chutzpah Test Adapter Plugin
or
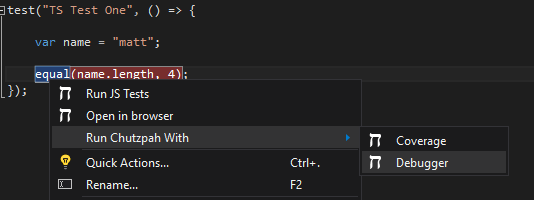
Run Chutzpah With -> Debugger when using the Chutzpah Context Menu Extension
Chutzpah will then launch Internet Explorer and attach the Visual Studio Debugger to it
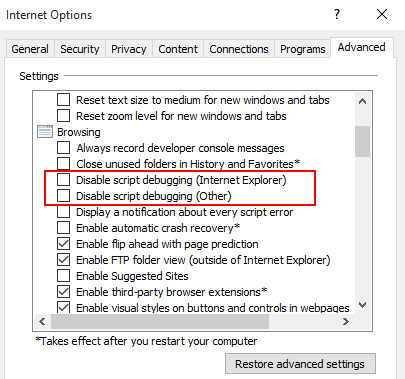
NOTE: Before this will work you must ensure script debugging is enabled in IE by going Tools->Internet Options->Advanced and unchecking both Disable script debugging settings.