calltrace.tutorial
And old coding relict of gcc, that also made it into clang, is the -finstrument-functions. When passed to the compiler, it will cause a call of
__cyg_profile_func_enter for every function entered, and __cyg_profile_func_exit for every function exited. These functions take a pointer
to the function and one to the location of the call.
Our provided source-file calltrace.c does implement those functions and connect them to our calltrace.
In order to build you will have to compile the sources that need tracing with passing -finstrument-function to the compiler and adding calltrace.c as a source.]
You can use the METAL_NO_INSTRUMENT macro to avoid functions to be instrumented.
The calltrace allows to trace the calls of a certain function. The calltrace is registered for a certain function, which means that it will only check what this function calls, but not nested calls.
void foo()
{
    foo2();
}

void bar()
{
    bar2();
}

void func()
{
    foo();
    bar();
}

void test_func()
{
    metal::test::calltrace<2> ct
        {
         &func,
         &foo, &bar
        };

    func();

    assert(ct);
}void foo()
{
foo2();
}
void bar()
{
bar2();
}
void func()
{
foo();
bar();
}
void test_func()
{
const void * ptr[] = {&foo, &bar};
metal_calltrace ct = {&func, ptr, 2, 0, 0};
metal_calltrace_init(&ct);
func();
assert(metal_calltrace_success(&ct));
metal_calltrace_deinit(&ct);
}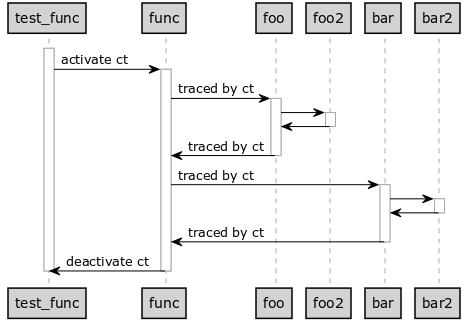
For the given example the calltrace will only check the calls made directly from foo and bar. But, since it might be desireable to trace those as well
several calltrace can be used at once.
Given that subcalls might be of interest the calltracing can be stacked. So we can extend the test given in the previous section by adding more detailed calltraces.
void test_func_ext()
{
    metal::test::calltrace<2> ct
        {
         &func,
         &foo, &bar
        };

    metal::test::calltrace<1> ct_foo
        {
         &foo,
         &foo2
        };

    metal::test::calltrace<1> ct_bar
        {
         &bar,
         &bar2
        };

    func();

    assert(ct);
    assert(ct_foo);
    assert(ct_bar);
}
void test_func_ext()
{
    const void * ptr[] = {&foo, &bar};
    metal_calltrace ct = {&func, ptr, 2, 0, 0};
    metal_calltrace_init(&ct);

    const void * foo2_ptr[] = {&foo2};
    metal_calltrace ct_foo2 = {&foo, foo2_ptr, 1, 0, 0};
    metal_calltrace_init(&ct_foo2);

    const void * bar2_ptr[] = {&bar2};
    metal_calltrace ct_bar2 = {&bar, bar2_ptr, 1, 0, 0};
    metal_calltrace_init(&ct_bar2);

    func();

    assert(metal_calltrace_success(&ct));
    assert(metal_calltrace_success(&ct_foo2));
    assert(metal_calltrace_success(&ct_bar2));

    metal_calltrace_deinit(&ct);
    metal_calltrace_deinit(&ct_foo2);
    metal_calltrace_deinit(&ct_bar2);
}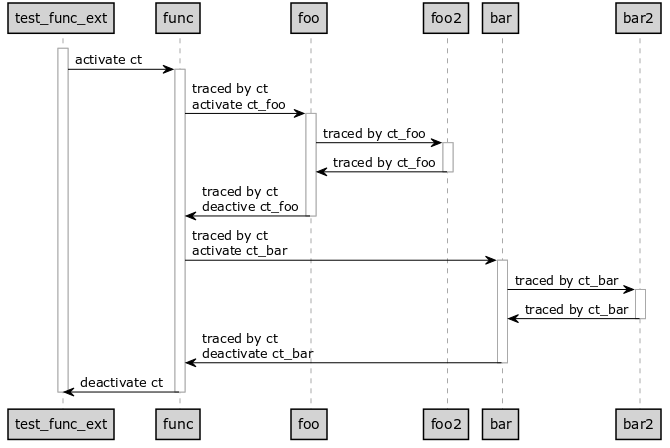
The default number is 16, but can be changed by defining METAL_CALLTRACE_STACK_SIZE with the appropriate number.
By using several calltraces we can thus also trace nested calls.
You can check that the calltrace was inited properly, i.e. placed on the calltrace stack,
by either calling inited in C++ or checking the return value of metal_calltrace_init in C.
The calltrace can also use a wildcard for a function, i.e. allow any function to be called. This might be useful in C, but is necessary in C++, because there is no way to obtain a pointer to a constructor or destructor, even though they will be traced.
struct foo
{
    foo();
    void bar();
    ~foo();
};

void func()
{
    foo f;
    f.bar();
}

void test_func()
{
    metal::test::calltrace<3> ct
        {
         &func,
         metal::test::any_fn, /*<The constructor call>*/
         &foo::bar,
         metal::test::any_fn  /*<The destructor call>*/
        };

    func();

    assert(ct);
}
A wildcard can be achieved by using any_fn in C++ or literal zero in the array for C.
The ctor call is only traced if the type is not a POD or the POD has a defined constructor.
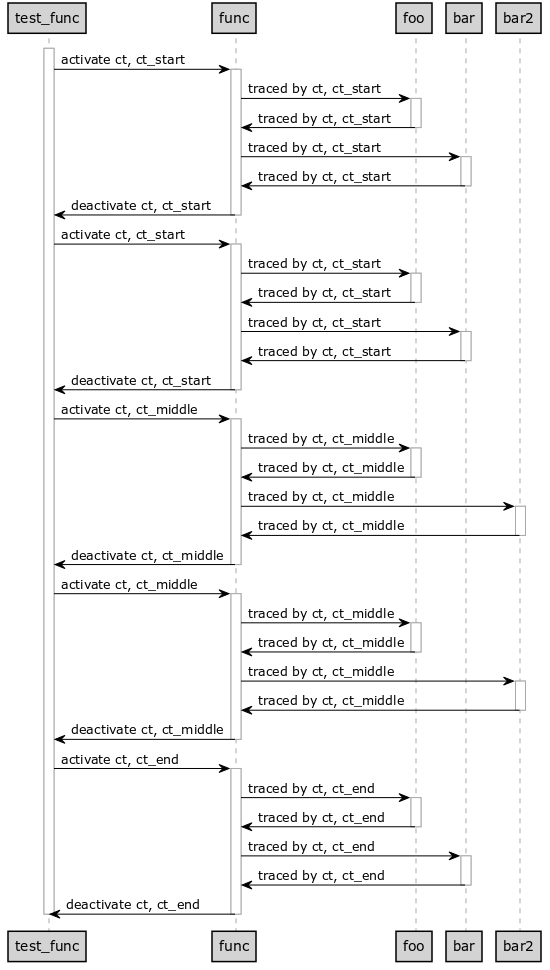
Since we can use small calltraces for nested calls, it might occur that some functions get activated several times. This can cause a problem if the sequence of the calls inside it changes. To workaround that, a calltrace an have a number of calls that are ignore before activating it, and a limit of calls it will get activated. The default behavior is that all calls are traced.
To demonstrate that we have a lonver example below, showing how to position different calltraces.
void foo();
void bar();
void bar2();

void func(bool switch_)
{
    foo();
    if (switch_)
        bar();
    else
        bar2();
}

void test_func()
{
    metal::test::calltrace<2> ct
        {
         &func,
         &foo,
         metal::test::any_fn /*<Wildcard for `bar` or `bar2`>*/
        };

    metal::test::calltrace<2> ct_start
        {
         &func,
         2, /*<Repeat two times>*/
         &foo, &bar
        };

    metal::test::calltrace<2> ct_middle
        {
         &func,
         2, /*<Repeat two times>*/
         2, /*<Offset, i.e. ignore the first two>*/
         &foo, &bar2
        };

    metal::test::calltrace<2> ct_end
        {
         &func,
         1, /*<Repeat only once>*/
         4, /*<Offset,i.e. ignore the first four>*/
         &foo, &bar
        };

    func(true);
    func(true);
    func(false);
    func(false);
    func(true);

    assert(ct);
    assert(ct_start);
    assert(ct_middle);
    assert(ct_end);
}void foo();
void bar();
void bar2();
void func(int switch_)
{
foo();
if (switch_ > 0)
bar();
else
bar2();
}
void test_func()
{
const void * ct_arr[] = {
&foo,
0 };/*<Wildcard for bar or bar2>*/
metal_calltrace ct =
{
&func,
ct_arr, 2,
0, 0 /*<Repeat as often as called and skip nothing>*/
};
assert(metal_calltrace_init(&ct));
const void* ct_start_arr[] = {&foo, &bar};
metal_calltrace ct_start =
{
&func,
ct_start_arr, 2,
2, /*<Repeat two times>*/
0 /*<No skip>*/
};
assert(metal_calltrace_init(&ct_start));
const void* ct_middle_arr[] = {&foo, &bar2};
metal_calltrace ct_middle =
{
&func,
ct_middle_arr, 2,
2, /*<Repeat two times>*/
2 /*<Offset, i.e. ignore the first two>*/
};
assert(metal_calltrace_init(&ct_middle));
metal_calltrace ct_end =
{
&func,
ct_start_arr, 2,
1, /*<Repeat only once>*/
4 /*<Offset,i.e. ignore the first four>*/
};
func(1);
func(1);
func(0);
func(0);
func(1);
assert(metal_calltrace_success(&ct));
assert(metal_calltrace_success(&ct_start));
assert(metal_calltrace_success(&ct_middle));
assert(metal_calltrace_success(&ct_end));
assert(metal_calltrace_deinit(&ct));
assert(metal_calltrace_deinit(&ct_start));
assert(metal_calltrace_deinit(&ct_middle));
assert(metal_calltrace_deinit(&ct_end));
}
Since functions can be overloaded in C++, but the calltrace must get a valid pointer, overloading can cause a lot of boilerplate code. The following code would fail to compile, because it yields an ambiguity error for automatic type deduction.
using namespace metal::test;

void foo(int);
void foo(double);

void func() {foo(42); foo(3.142);}

calltrace<2> ct{&func,
                &foo,
                &foo};
The valid C++ solution is to add a static_cast to force the compiler to use the right function.
calltrace<2> ct{&func,
                static_cast<void(*)(int)>   (&foo),
                static_cast<void(*)(double)>(&foo)};
This does work, but it can get quite tedious for member-function pointers, which have weird syntax as shown below:
struct bar
{
   void f() const;
   void f(double);
};

void func2()
{
   bar b;
   b.f();
   b.f(3.142);
};

calltrace<2> ct{&func2,
                static_cast<void(bar::*)() const>(&bar::f),
                static_cast<void(bar::*)(double)>(&bar::f)};
To easen that this library provides a set of types that allow you to easier select overloaded functions. Please see the reference for more details.
calltrace<4> ct{&func,
                fn<void(int)>(&foo),      //Select by signature
                fn<void(double)>(&foo),   //Select by signature
                fn<void()>(&bar::f),      //Select by signature
                mem_fn<>(&bar::f),        //Select by qualification
                mem_fn_c<>(&bar::f),      //Select by qualification
                mem_fn<void()>(&bar::f),        //Select by qualification and signature
                mem_fn_c<void(double)>(&bar::f) //Select by qualification and signature
                };
When used with the dbg-runner the calltrace can add a timestamp to the output if the corresponding function is provided. Examples are given below.
#include <metal/calltrace.hpp>
#include <chrono>

extern "C" { extern int __metal_calltrace_size; }

metal::test::timestamp_t metal::test::timestamp()
{
    int sz = __metal_calltrace_size;
    __metal_calltrace_size = 0;

    auto ts = std::chrono::system_clock::now()
                .time_since_epoch().count();

    __metal_calltrace_size = sz;
    return ts;
}#include <metal/calltrace.h>
#include <time.h>
metal_timestamp_t metal_timestamp()
{
return (metal_timestamp_t)time(0);
}The C++ example explicitly disable the calltrace, because the inlined functions could be traced as well. C does not need to do that.
The plugin can also do this through the metal.runner when --metal-calltrace-manual-disable is passed.