
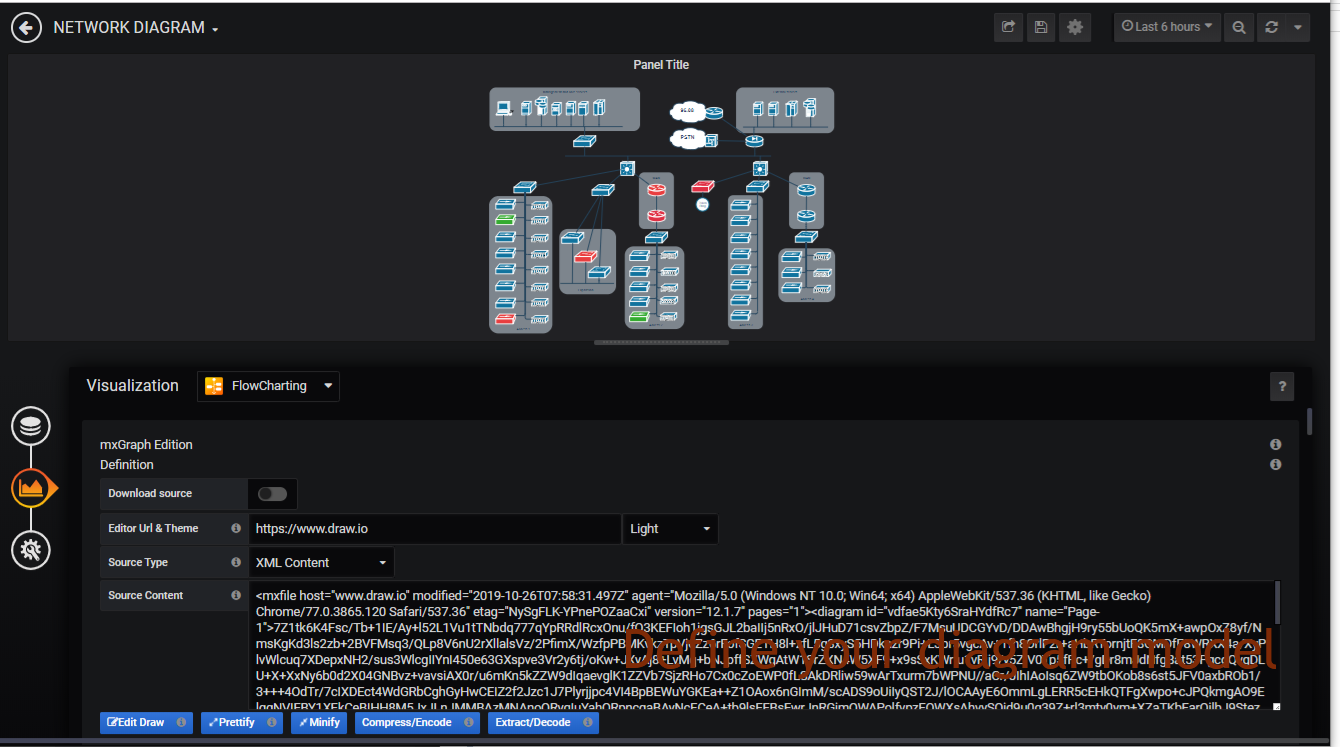
Flowcharting is a plugin for grafana. It aims to display complexe diagram draws with draw.io like Visio. Few examples :
- Technical architecture schema (Legacy, Cloud, Azure, AWS, GCP, Kubernetes, Terraform)
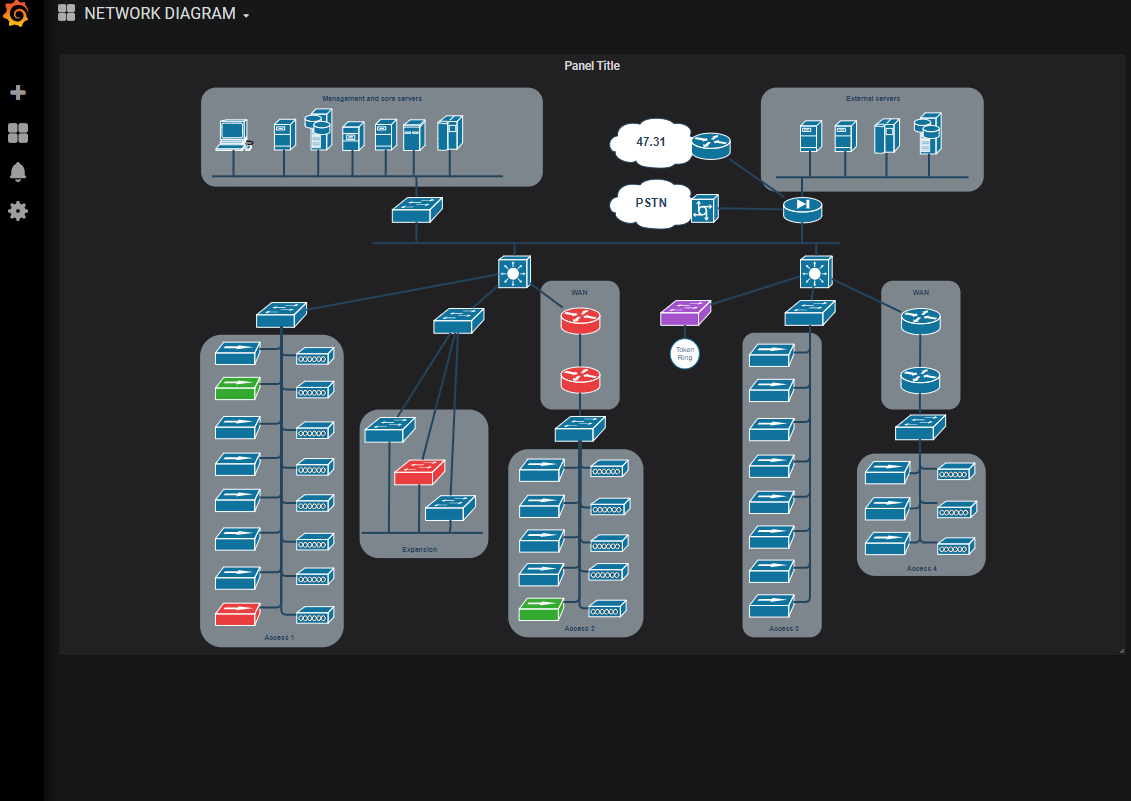
- Diagrams (network, electric, flows ...)
- Organic plans
- Floorplans
- UML plan
- Workflows (Jenkins, Ansible Tower, OpenShift, ...)
Draw your artwork and monitor it.
- Technical schema example

See more example at draw.io
https://algenty.github.io/flowcharting-repository/STARTED.html
https://algenty.github.io/flowcharting-repository/
https://github.com/algenty/grafana-flowcharting
[0.5.0] - 2019-10-17
- 2 new modes for "Update text value" (See example)
- Append (Space) : Concat metrics with a space as a separator
- Append (New line) : Concat metrics with a line break
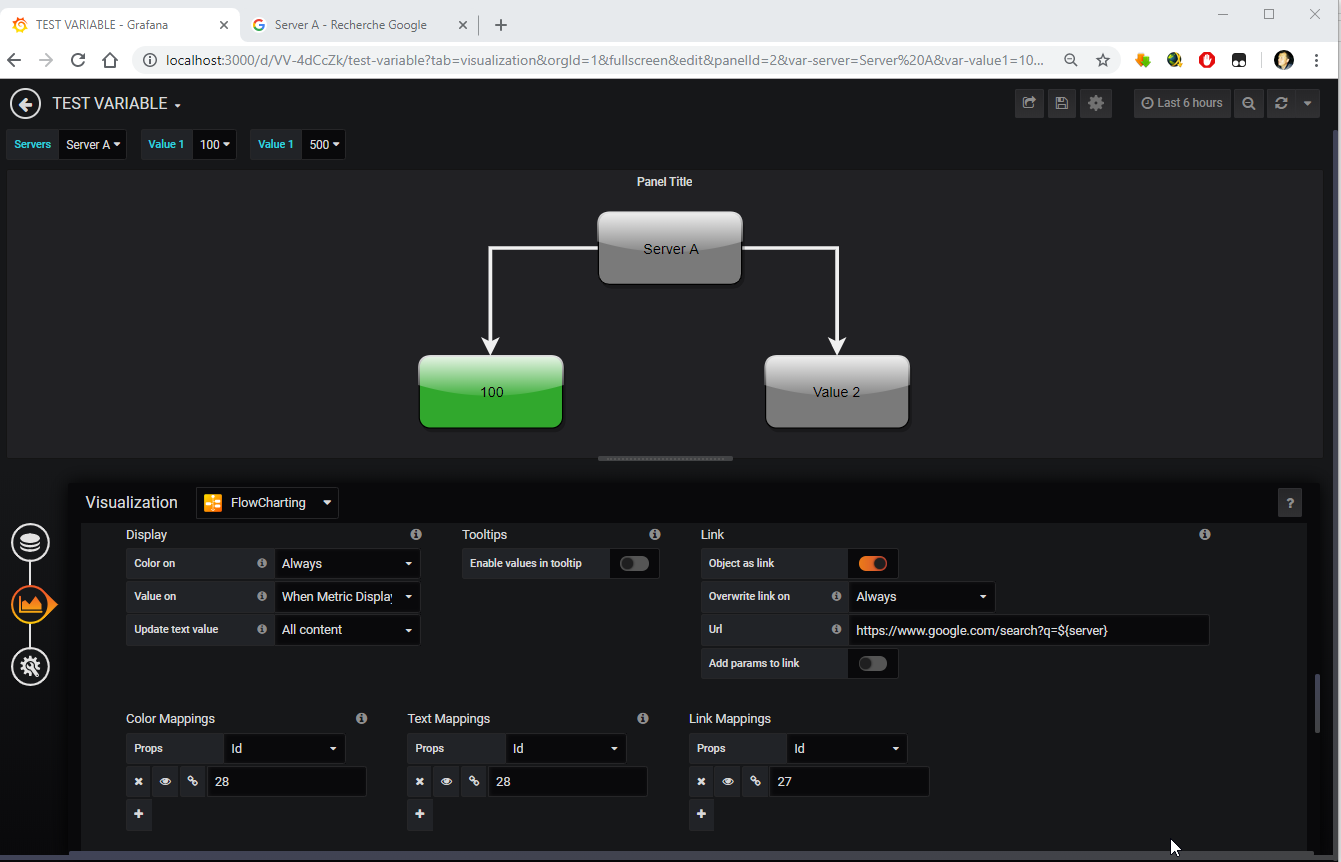
- Variabilization in "Url" for link mapping (See example)
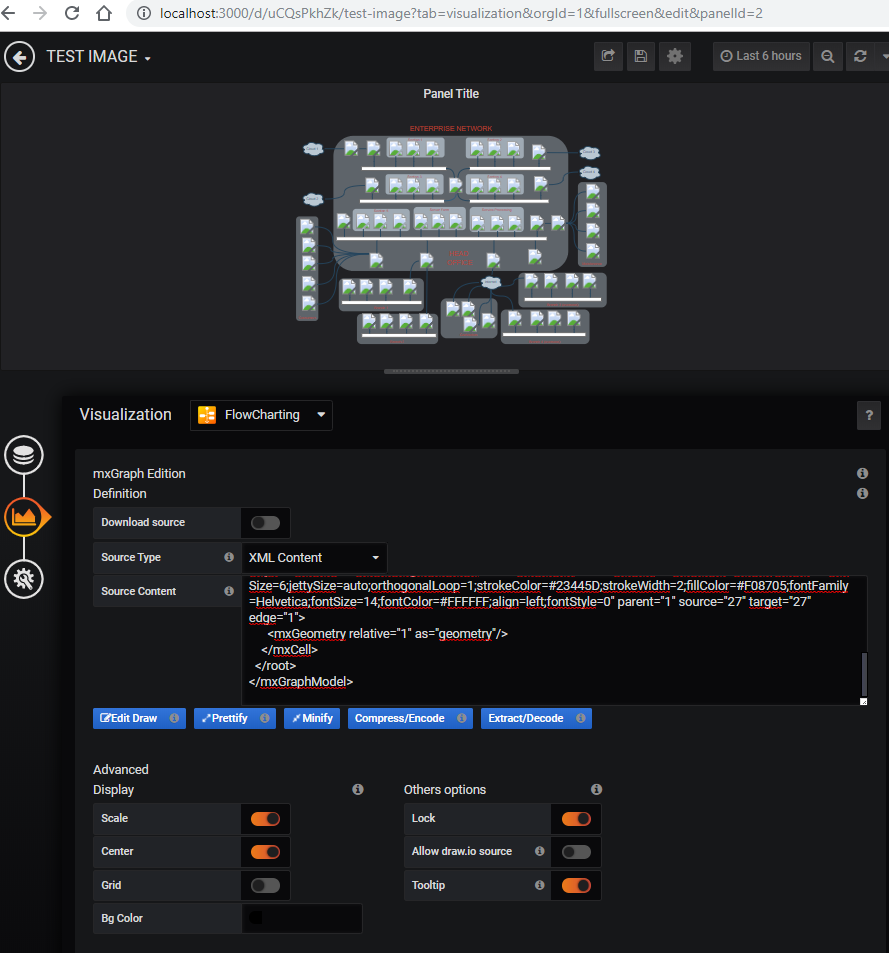
- New check box to allow download images from draw.io (See example)
- New editor option :
- Choose other editor draw.io like internal website
- Choose the theme of editor
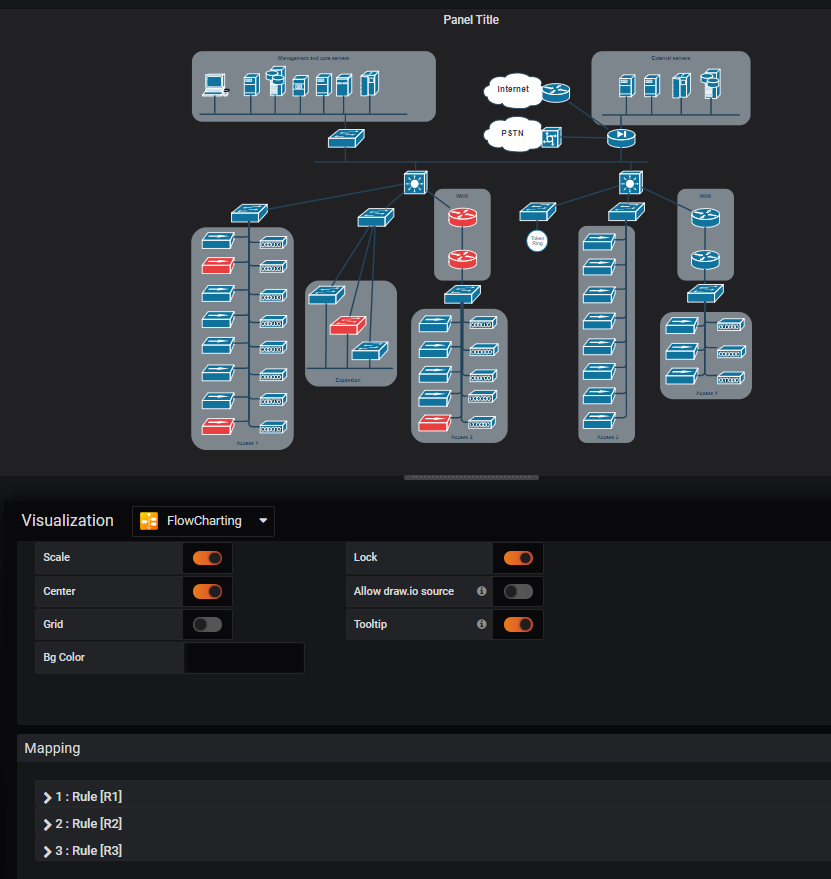
- New identification mode for shapes when mouse cursor is over the rules or the mapping (See example)
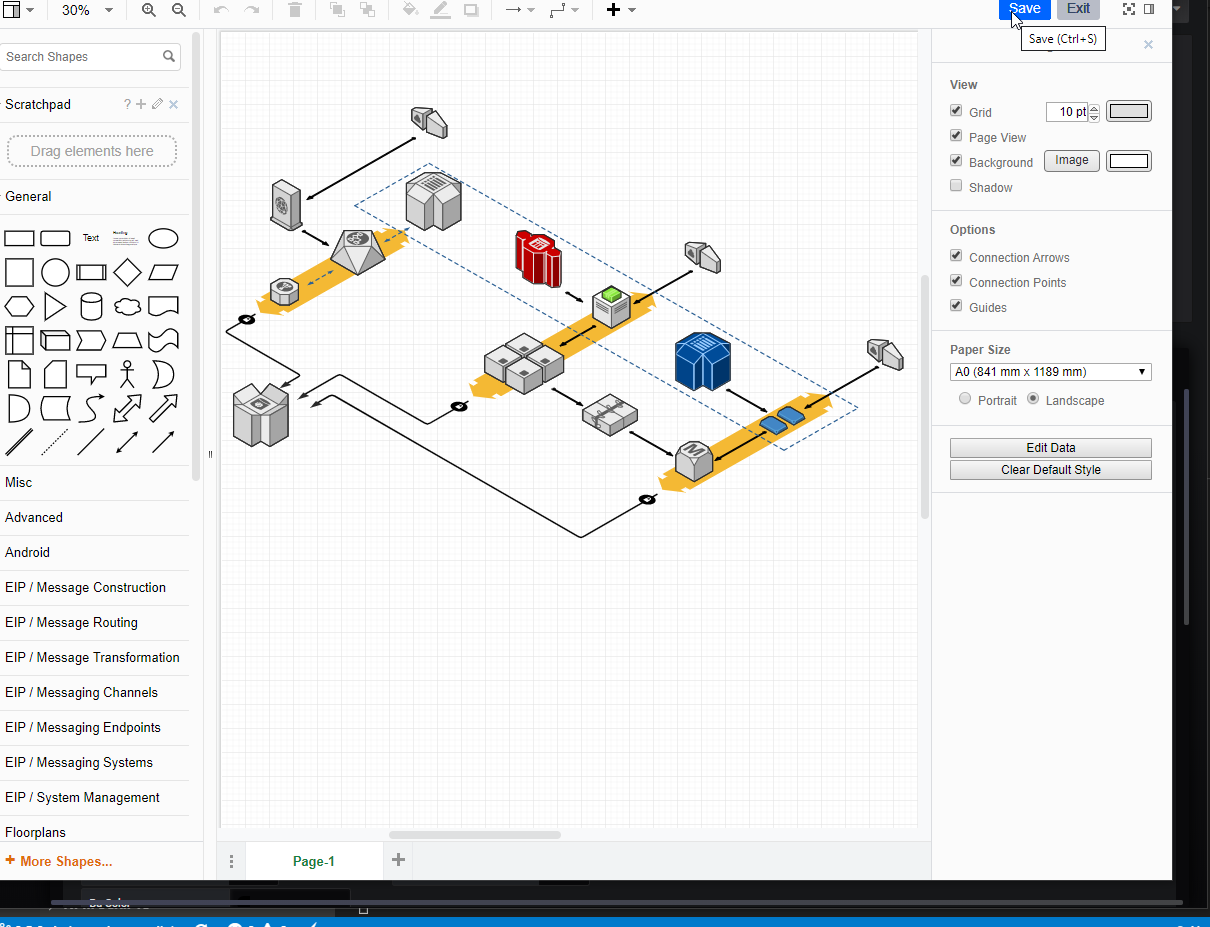
- Support Dynamic shapes like Floorplan, isometric plans and more (See example)
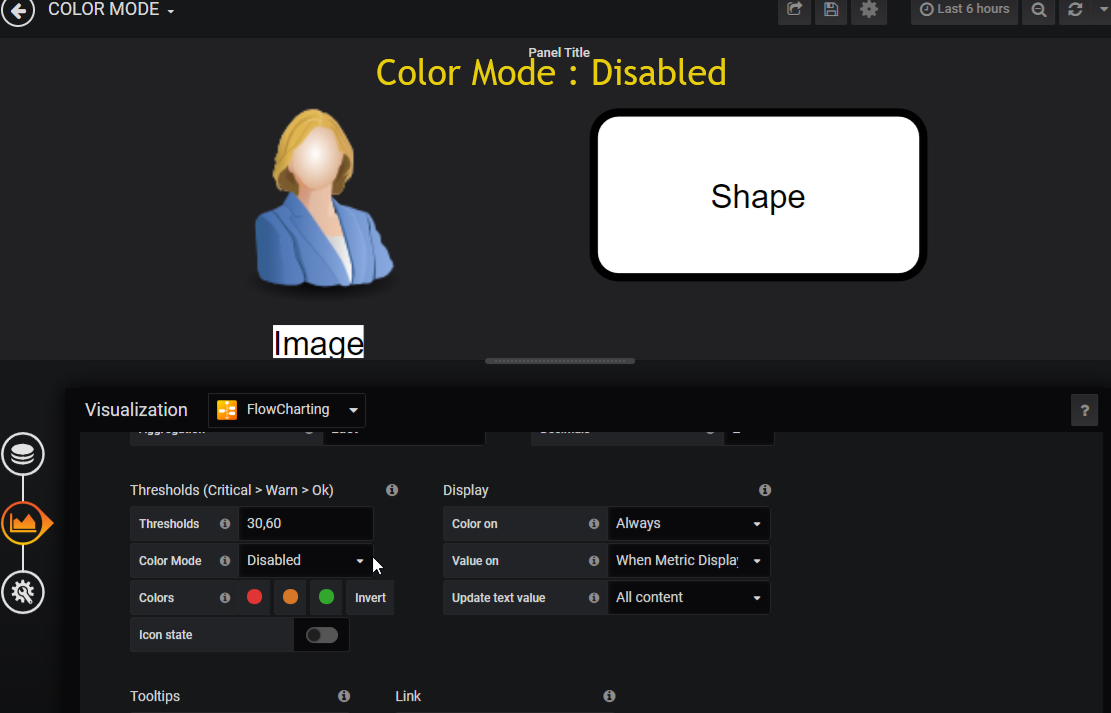
- New color mode for no SVG object like pictures/cliparts/images (See example)
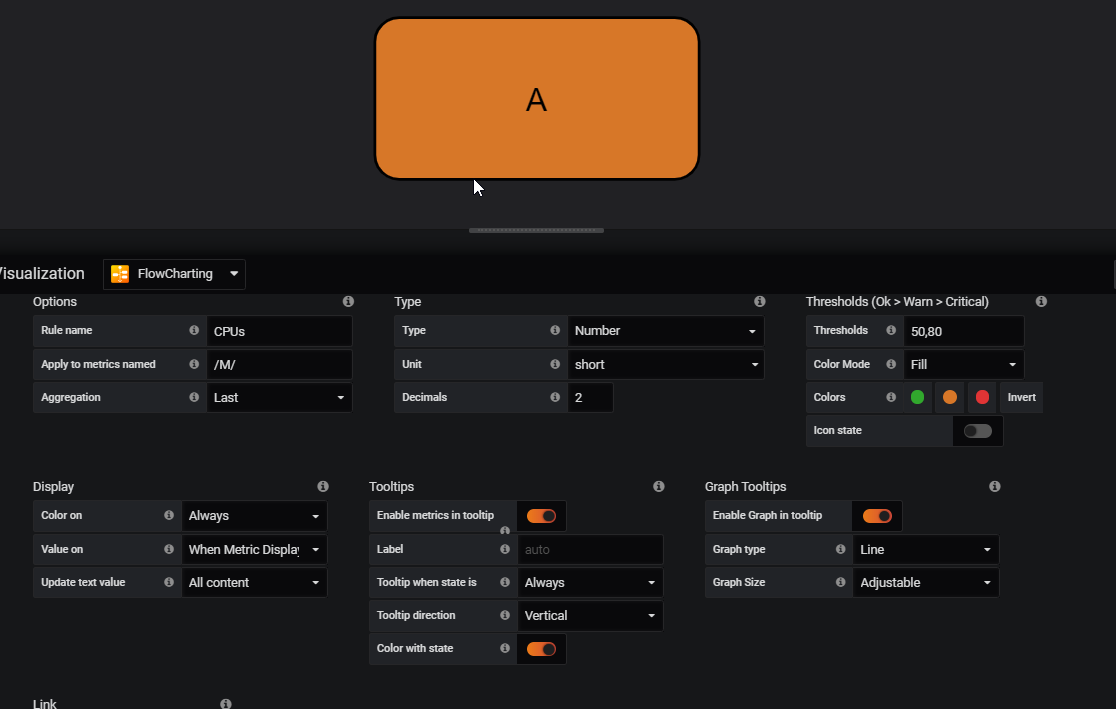
- Graphs in tooltip (See example)
- Color graph with defined colors in threshold
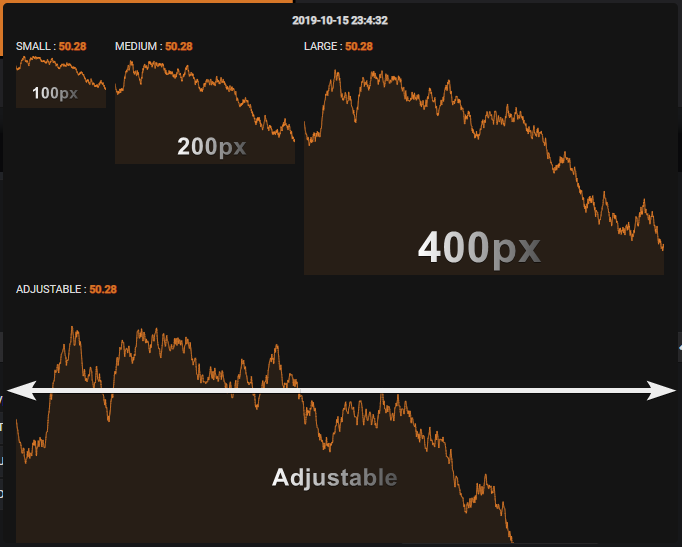
- Size of graph (See example)
- Scale of graph (Y-min and Y-max)
- Define the orientation in tooltip for each metrics/graph in tooltips : horizontal or vertical (See example)
- Some optimizations, Display is twice as fast on load.
- Fix color to reset when "Color on" is "Always/Critical" and metric is OK
- Fix border to empty instead black when "color mode" is "Fill" (issue #24)
- Fix error when "Value On" is not "When metric displayed"
- Fix Link (issue #37)
- Fix hyperlink text appears in white over flowchart (issue #45)
- Fix "Multiple FlowCharts On a Dashboard", when edit, both are the same draw (issue #48)
- Fix options after reload or variable changed (issue #44)
- Fix auto reset zoom/unzoom when data refreshed, only ESC or change options on flowchart reset zoom now (issue #38)
- Fix error for BPNM shapes (Issue #51)
- Fix display when center and scale are checked on flowchart options.
- Fix Zoom with mouse wheel for firefox and Edge.
[0.4.0] - 2019-09-26
- Draw.io editor (see example)
- Open draw.io with dark theme for better rendering
- Display waiting screen when loading xml definition.
- Upgrading libraries
- mxGraph 4.0.4
- draw.io 11.2.8
- Graph definition
- Adding download function to download source by http on load. (See example)
- Metric
- Adding string support for state (See example)
- Zoom (issue #19) (See example)
- On the mouse pointer : Ctrl + Mouse
- Hold right button to move diagram.
- double click on shape to zoom on.
- Escape key to restore.
- Tooltip/popup support (see example)
- Grafana style css and date
- Adding metrics with color according levels
- Adding colors on metrics in tooltip
- Adding date of change
- Adding label input for metric
- Variables/templates support, accept variable like ${} (See example)
- In xml definition
- In text mapping when type in sring for "Range to text" and "Value to text"
- In link ovewrite
- full shapes from draw.io included (See example)
- Some optimizations on render and display.
- Optimization when refresh/render (issue #15)
- No decimal fixed when 0 (issue #23)
- Text substring and color (issues #29)
- Fix formatted text when label is html (issues #21)
- Work around a bug since Grafana 6+ (issues 19426 grafana)
All notable changes to this project will be documented in this file.
The format is based on Keep a Changelog, and this project adheres to Semantic Versioning.
- Custom libs.
- Internat draw.io website (issue #43)
- Display tooltip (done in 0.4.0)
- Export SVG, png, options
- Add data in tooltip (done in 0.4.0)
- Use variables/templates in graph (done in 0.4.0)
- Add custom stencils/libs from draw.io (done in 0.4.0)
- Support light theme
- Annotation
- Tooltips on text and arrow/line
- Url source download (done in 0.4.0)
- Special rule according level (hide, show, change form, move, infront, in back, attributes, ...)
- Custom variables like ${_label},${_value}, ${_alias}, ${_rule}, ${_level} ...
- Variable support in link (done in 0.5.0)
- Zoom/Unzoom (done in 0.4.0)
- Shared graph crosshair
- CSV source
- Map/search shape by value
- Variables support for downloaded source and compressed source
- Multi graph with auto link when errors
- Gradien Mode for color
- More than 3 colors
- Graph in tooltip
- Histogram
- Merge Graphs
- carriage return after new rule in tooltips option
- Filter for null values in graph
- Inspector on series
- New style for image : imageBackground, imageBorder
- Support cloud images from draw.io
- Support images from draw.io (done in 0.5.0)
- Add append mode on text with CR or space (done in 0.5.0)
- Having troubles with flowcharting ? Check out issues
- Email : [email protected]
- Twitter : https://twitter.com/gf_flowcharting
- [AngularJS] - HTML enhanced for web apps!
- [lodash] - awesome web-based text editor
- [jquery] - Markdown parser done right. Fast and easy to extend.
- [mxGraph] - great UI boilerplate for modern web apps
- [pako] - Zlib port to javascript
- [vkbeautify] - Pretty prints and minifies XML/JSON/SQL/CSV
- [sanitizer] - Caja's HTML Sanitizer
- [jest] - Delightful JavaScript Testing
- [express] - Fast, unopinionated, minimalist web framework
- [babel] - Soft cushion between you all the cool new file formats being developed for node.js such as CoffeeScript, SASS, and Jade.
- [grunt] - The JavaScript Task Runner
- [webpack] - Packs CommonJs/AMD modules for the browser. Allows to split your codebase into multiple bundles, which can be loaded on demand. Support loaders to preprocess files, i.e. json, jsx, es7, css, less, ... and your custom stuff.
Flowcharting requires Grafana v5+ to run (not tested lower version) Download and install it
$ cd $grafana_home/data/plugin
$ wget --no-check-certificate https://github.com/algenty/grafana-flowcharting/archive/master.zip
$ unzip master.zip
grafana-cli plugins install agenty-flowcharting-panel$ git clone https://github.com/algenty/grafana-flowcharting
$ yarn install --dev
$ yarn build init
$ yarn build
$ # Make zip file plugin in archives dir
$ yarn build archive
$ # for dev watching
$ yarn build dev