ocperf is a wrapper to "perf" that provides a full core event list for common Intel CPUs. This allows to use all the Intel defined events, not just the builtin events of perf.
A more detailed introduction is in Andi's blog
List all the events perf and ocperf supports on the current CPU
ocperf.py stat -e eventname ...

ocperf.py record -c default -e eventname ...

ocperf.py report
When an older kernel is used with offcore events (events that count types of memory accesses outside the CPU core) that does not support offcore events natively, ocperf has to run as root and only one such profiling can be active on a machine.
When "-c default" is specified for record, the default sampling overflow value will be filled in for the sampling period. This option needs to be specified before the events and is not supported for all CPUs. By default perf uses a dynamic sampling period, which can cause varying (and sometimes large) overhead. The fixed period minimizes this problem.
If you have trouble with one of the many acronyms in the event list descriptions, the Intel optimization manual describes many of them.
ocperf.py can be also used as a python module to convert or list events for the current CPU:
	import ocperf

	emap = ocperf.find_emap()
	if not emap:
		sys.exit("Unknown CPU or cannot find event table")
	ev = emap.getevent("BR_MISP_EXEC.ANY")
	if ev:
		print "name:", ev.output()
		print "raw form:", ev.output(use_raw=True)
		print "description:, ev.desc
To retrieve data for other CPUs set the EVENTMAP environment variable to the csv file of the CPU before calling find_emap()
The msr.py, pci.py, latego.py can be used as standalone programs or python modules to change MSRs, PCI config space or enable/disable the workarounds.
For example to set the MSR 0x123 on all CPUs to value 1 use:
$ sudo ./msr.py 0x123 1
To read MSR 0x123 on CPU 0
$ sudo ./msr.py 0x123
To read MSR 0x123 on CPU 3:
$ sudo python
>>> import msr
>>> msr.readmsr(0x123, 3)
To set bit 0 in MSR 0x123 on all CPUs:
$ sudo python
>>> import msr
>>> msr.writemsr(0x123, msr.readmsr(0x123) | 1)
(this assumes the MSR has the same value on all CPUs, otherwise iterate the readmsr over the CPUs)
Identify the micro-architectural bottleneck of a workload.
The bottlenecks are expressed as a tree with different levels (max 5). Each bottleneck is only meaningful if the parent higher level crossed the threshold (it acts similar to a binary search). The tool automatically only prints meaningful ratios, unless -v is specified.
This follows the "Top Down" methodology. The best description of the method is in the "A top-down method for performance analysis and counter architecture" paper (ISPASS 2014, available here) I didn't invent it, I'm just implementing it.
A more gentle introduction is in andi's blog
Please also see the manual and tutorial
toplev.py only supports counting, that is it cannot tell you where in the program the problem occurred, just what happened. There is now an experimental --show-sample option to suggest sampling events for specific problems. The new --run-sample option can also automatically sample the program by re-running.
Requires Intel CPUs Sandy Bridge (Core 2nd gen, Xeon 5xxx) or newer or Atom Silvermont or newer. Quark or Xeon Phi are not supported.
By default the simple high level model is used. The detailed model is selected with -lX, with X being the level.
On non-SMT systems only the program is measured by default, while with SMT on the whole system is measured.
Please see the ucevent documentation
interval-plot.py can plot the output of perf stat -I1000 -x
Requires matplotlib to be installed.
Below is the level 2 toplev measurement of a Linux kernel compile. Note that tl-barplot below is normally better to plot toplev output.
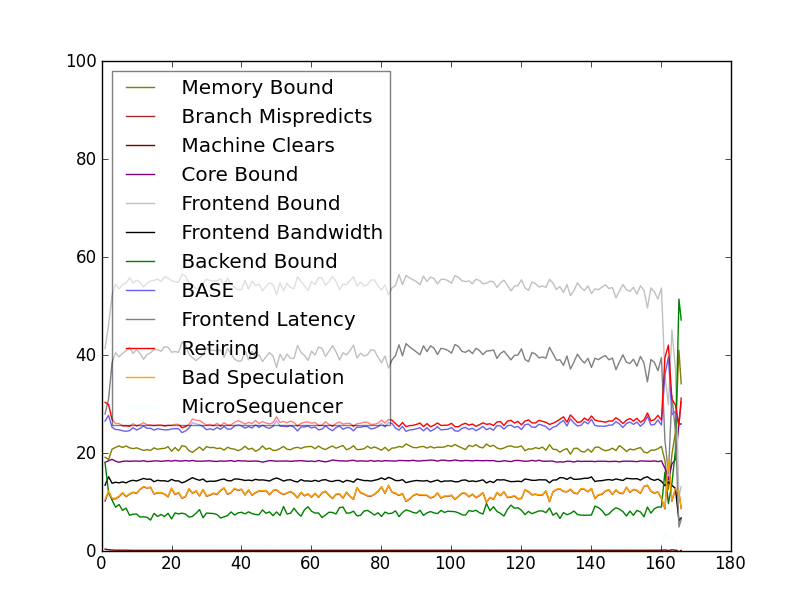
This converts the output of perf stat -Ixxx -x, / toplev.py -Ixxx -x, to a normalized output (one column for each event). This allows easier plotting and processing with other tools (spreadsheets, R, JMP, gnuplot etc.)
Plot an already normalized data file. Requires pyplot to be installed.
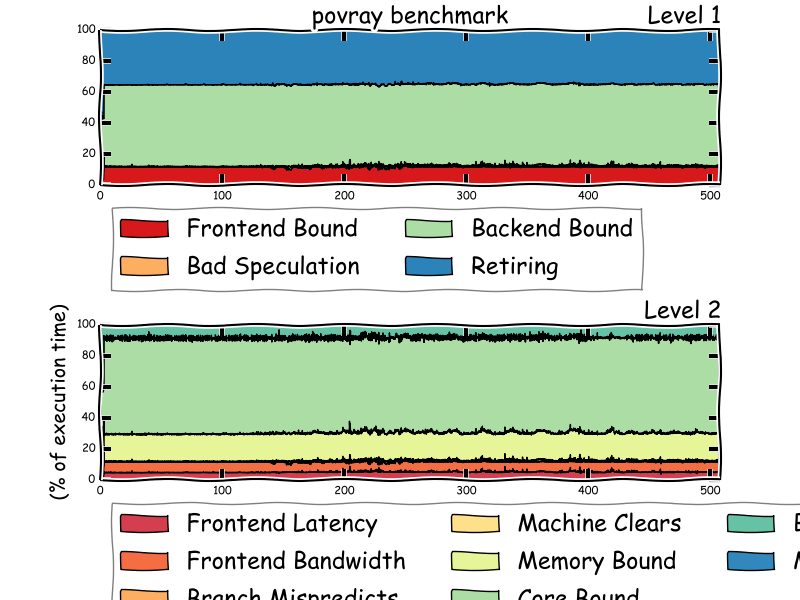
Plot output from toplev.py -I 1000 -v -x, --output file.csv -lLEVELS toplev outputs percentages, so it's better to use a stacked plot, instead of the absolute values interval-plot displays. tl-barplot implements a stacked barplot plot.
Requires matplotlib to be installed.
toplev.py --single-thread -l3 --title "GNU grep" --graph grep -r foo /usr/*

This assumes the workload is single threaded. tl-barplot can only display a single CPU, if --single-thread is not appropriate then the CPU to plot needs to be specified with --graph-cpu.
With a new enough matplotlib you can also enable xkcd mode (install Humor Sans first)
Display toplev.py output in a web browser.
Download dygraphs. Only needs to be done once.
wget http://dygraphs.com/1.0.1/dygraph-combined.js
Run toplev:
toplev.py --all -I 100 -o x.csv ...
tl-serve.py x.csv
Then browse http://localhost:9001/ in your web browser.
query cpu topology and print all matching cpu numbers cputop "query" ["format"]
query is a python expression, using variables: socket, core, thread or "offline" to query all offline cpus format is a printf format with %d. %d will be replaced with the cpu number. format can be offline to offline the cpu or online to online
Print all cores on socket 0
cputop "socket == 0"
Print all first threads in each core on socket 0
cputop "thread == 0 and socket == 0"
Disable all second threads (disable hyper threading)
cputop "thread == 1" offline
Reenable all second threads (reenable hyper threading)
cputop "thread == 0" online
Older perf doesn't export the raw PEBS output, which contains a lot of useful information. PEBS is a sampling format generated by Intel CPUs for some events.
pebs-grabber grabs PEBS data from perf. This assumes the perf pebs handler is running, we just also do trace points with the raw data.
May need some minor tweaks as kernel interface change, and will also not likely work on very old kernels.
This will create two new trace points trace_pebs_v1 and trace_pebs_v2 that log the complete PEBS record. When the CPU supports PEBSv2 (Haswell) the additional fields will be logged in pebs_v2.
  make [KDIR=/my/kernel/build/dir]
  insmod pebs-grabber.ko
  # needs to record as root
  perf record -e cycles:p,pebs_v1,pebs\_v2 [command, -a for all etc.]
  perf report
  perf script to display pebs data
  # alternatively trace-cmd and kernelshark can be also used to dump
  # the pebs data
See http://download.intel.com/products/processor/manual/253669.pdf 18.10.2 for a description of the PEBS fields.
Note this doesn't work with standard FC18 kernels, as they broke trace points in modules. It works with later and earlier kernels.
event-rmap [cpu] prints the currently running events. This provides an easier answer to question Q2j in Vince Weaver's perf events FAQ.
When modifying toplev please run tl-tester. For ocperf run tester. For jevents run jevents/tester. other-tester tests other random tools. The all-tester script runs all test suites.