Azure Event Hubs collects the same kinds of monitoring data as other Azure resources that are described in Monitoring data from Azure resources.
See Azure Event Hubs monitoring data reference for a detailed reference of the logs and metrics created by Azure Event Hubs.
Platform metrics and the activity log are collected and stored automatically, but can be routed to other locations by using a diagnostic setting.
Resource Logs aren't collected and stored until you create a diagnostic setting and route them to one or more locations.
See Create diagnostic setting to collect platform logs and metrics in Azure for the detailed process for creating a diagnostic setting using the Azure portal, CLI, or PowerShell. When you create a diagnostic setting, you specify which categories of logs to collect. The categories for Azure Event Hubs are listed in Azure Event Hubs monitoring data reference.
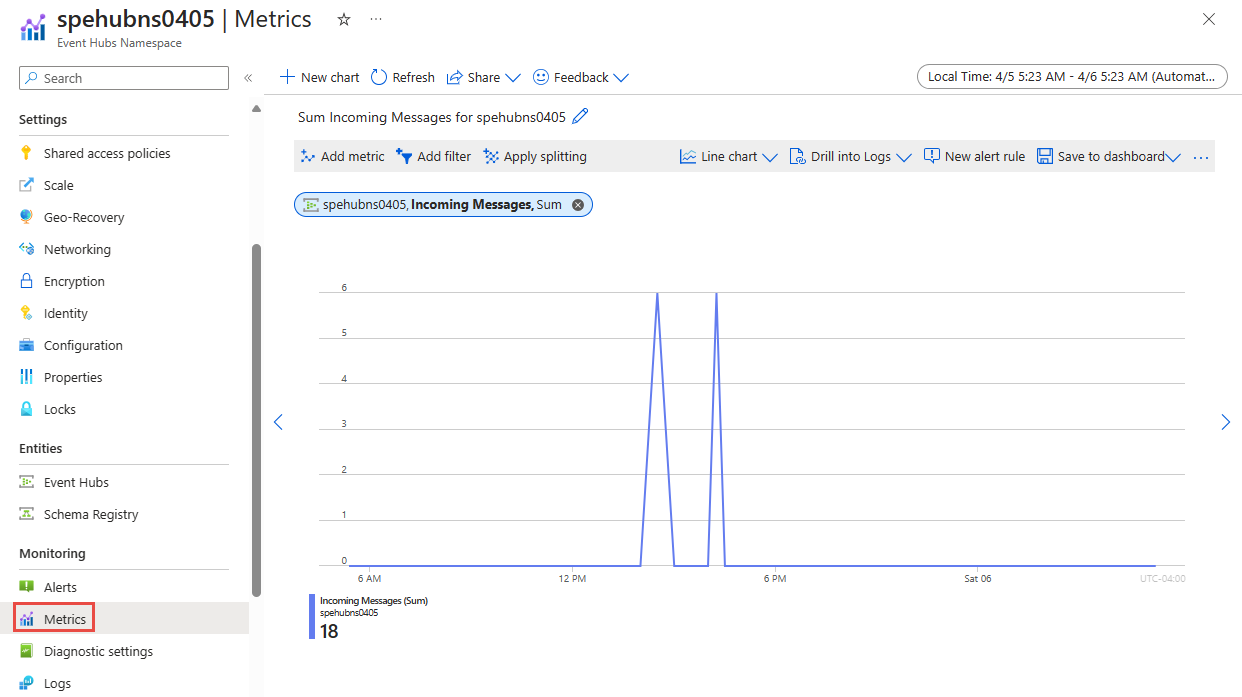
You can analyze metrics for Azure Event Hubs, along with metrics from other Azure services, by selecting Metrics from the Azure Monitor section on the home page for your Event Hubs namespace. See Getting started with Azure Metrics Explorer for details on using this tool. For a list of the platform metrics collected, see Monitoring Azure Event Hubs data reference metrics.
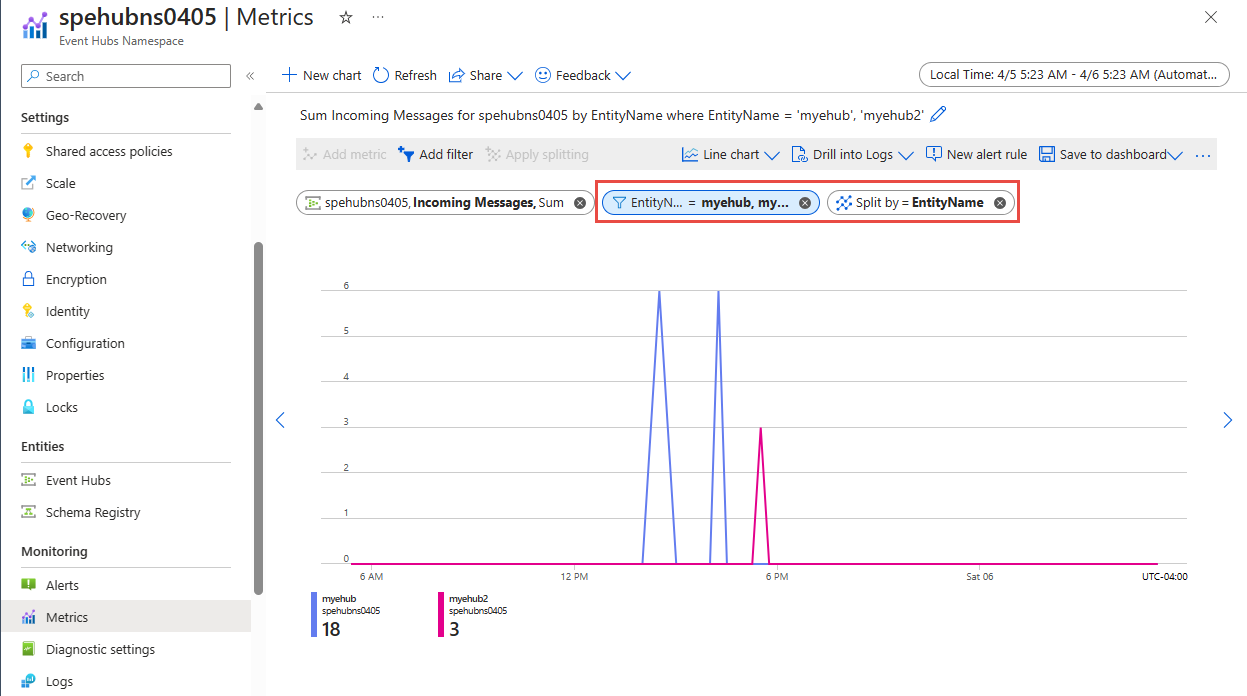
For metrics that support dimensions, you can apply filters using a dimension value. For example, add a filter with EntityName set to the name of an event hub. You can also split a metric by dimension to visualize how different segments of the metric compare with each other. For more information of filtering and splitting, see Advanced features of Azure Monitor.
Using Azure Monitor Log Analytics requires you to create a diagnostic configuration and enable Send information to Log Analytics. For more information, see the Collection and routing section. Data in Azure Monitor Logs is stored in tables, with each table having its own set of unique properties. Azure Event Hubs stores data in the following tables: AzureDiagnostics and AzureMetrics.
Important
When you select Logs from the Azure Event Hubs menu, Log Analytics is opened with the query scope set to the current workspace. This means that log queries will only include data from that resource. If you want to run a query that includes data from other databases or data from other Azure services, select Logs from the Azure Monitor menu. See Log query scope and time range in Azure Monitor Log Analytics for details.
For a detailed reference of the logs and metrics, see Azure Event Hubs monitoring data reference.
Important
When you select Logs from the Azure Event Hubs menu, Log Analytics is opened with the query scope set to the current Azure Event Hubs namespace. This means that log queries will only include data from that resource. If you want to run a query that includes data from other workspaces or data from other Azure services, select Logs from the Azure Monitor menu. See Log query scope and time range in Azure Monitor Log Analytics for details.
Following are sample queries that you can use to help you monitor your Azure Event Hubs resources:
-
Get errors from the past seven days
AzureDiagnostics
| where TimeGenerated > ago(7d)
| where ResourceProvider =="MICROSOFT.EVENTHUB"
| where Category == "OperationalLogs"
| summarize count() by "EventName"
-
Get runtime audit logs generated in the last one hour.
AzureDiagnostics
| where TimeGenerated > ago(1h)
| where ResourceProvider =="MICROSOFT.EVENTHUB"
| where Category == "RuntimeAuditLogs"
-
Get access attempts to a key vault that resulted in "key not found" error.
AzureDiagnostics
| where ResourceProvider == "MICROSOFT.EVENTHUB"
| where Category == "Error" and OperationName == "wrapkey"
| project Message
-
Get operations performed with a key vault to disable or restore the key.
AzureDiagnostics
| where ResourceProvider == "MICROSOFT.EVENTHUB"
| where Category == "info" and OperationName == "disable" or OperationName == "restore"
| project Message
-
Get capture failures and their duration in seconds
AzureDiagnostics
| where ResourceProvider == "MICROSOFT.EVENTHUB"
| where Category == "ArchiveLogs"
| summarize count() by "failures", "durationInSeconds"
You can access alerts for Azure Event Hubs by selecting Alerts from the Azure Monitor section on the home page for your Event Hubs namespace. See Create, view, and manage metric alerts using Azure Monitor for details on creating alerts.
For more detail please visit Event Hub Monitoring
This section shows How-To
- Collection and routing
- Analyzing metrics
- Filtering and splitting
- Analyzing logs