BalenaSense was designed as an open source project to make it fast and easy to connect a sensor to a Raspberry Pi and see sensor measurement history on a Grafana dashboard.
The core of balenaSense V2 is the sensor block which is prebuilt functionality that auto-detects connected I2C sensors and publishes the sensor data on HTTP or MQTT.
In fact, balenaSense V2 is composed entirely of blocks. (See this blog post to learn more about blocks.)
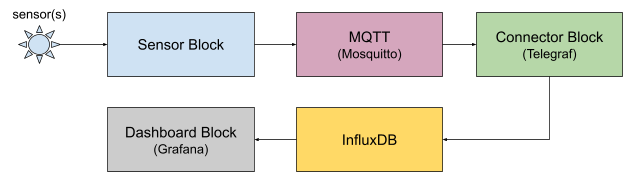
Due to the auto-configuration properties of balena blocks, very little setup is required beyond merely including these compatible blocks in the docker-compose file. The data flow from sensor to dashboard is described below:
If the sensor block detects a service on the device named “MQTT” it will publish its sensor data measurements to that broker. The Connector block is also designed to look for an MQTT service. It will automatically pull any MQTT data from an onboard broker as long as the topic is named “sensors”.
If the Connector block finds an Influx time series database service on the device named “influxdb” it will automatically push the sensor data to it.
The Dashboard block automatically connects to any onboard InfluxDB containers named “influxdb”, discovers the database schema, and generates a dashboard. If it’s the only dashboard it will become the default.
To learn more about the block-based design of balenaSense V2, check out this blog post. In addition, much more detailed information about the operation and configuration (both automatic and manual) are available in the GitHub repositories for each individual block: